A.IMAGING TECHNIQUE
1.US using curvilinear abdominal probe,
frequency 2-7MHz and color Doppler technique.
2.The CT protocol:
- non-enhanced CT(NECT)-5mm slice thickness;
- triphasic contrast-enhanced CT(CECT) with MPR:
- corticomedullary phase(25-40 seconds delay),
- nephrographic(80-90 seconds delay),
- excretory phase(240-300 seconds delay)
- 1,5ml/kg body weight of iodinated CM(370 mg iodine/ml)
3.MRI performed with a 1.5-T system during an end-expiratory breath hold using:
-axial T1-w in/opposed-phase;
-axial/coronal T2-w with/without fat suppression(FS);
-3D T1-w with FS,
before and after administration of an intravenous
CM (gadolinium chelate - 0.1 mmol/kg)–dynamic triphase protocol.
B.IMAGING FINDINGS
B.1.CLASSICAL AML-macroscopic fat
- US-classical AMLs[5] are identified as hyperechoic(~renal sinus fat) mass located in the renal cortex(Fig.
1) and those<3cm can present posterior acoustic shadow(interphase between multiple tissues).
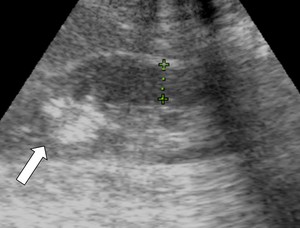
Fig. 1: Kidney US showing a predominantly hyperechogenic nodular mass (white arrow) in the upper pole of the right kidney, suggestive for classical AML.
- NECT:well-defined homogeneous/heterogeneous mass with fatty attenuation(ROI<-10 HU).When a small amount of fat is suspected a NECT examination with thin sections(1.5-3mm) and attenuation measurements using small ROI or even pixel analysis are necessary to confirm it,
otherwise would not be detected because of partial volume-averaging.
.
- CECT:bridging intratumoral vessels can be seen(Fig.
2).
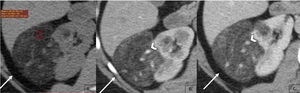
Fig. 2: Classic AML with extra renal growth: ax NECT image 5mm section (A) shows a right kidney mass with fat attenuation (arrow) associated with a renal parenchymal defect, no enhancement on corticomedullary (B) and nephrographic phases (C) and bridging vessels(arrow head).
- MRI:
-high signal intensity in SE sequences(T1w and T2w) with signal loss using selective FS technique;
-drop of signal-intensity in out-of-phase sequences with respect to images in-phase due to intracytoplasmic fat content(Fig.
3).
Chemical shift imaging(CSI) detects gross fat.
The macroscopic fat will be present as an India ink artefact(black delineation) at the kidney-lesion interface or at the fat and non-fatty regions borders. India ink artefact can reliable diagnose AMLs<1cm,
where the measurement of HU on CT can be uncertain[6].
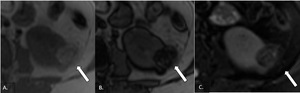
Fig. 3: MRI axial sections showing focal lesion with predominantly high signal intensity on T1 in-phase (A) and drop of signal in out-of-phase (B) sequence and fat suppression on T2-w FS, confirming the fat component of the lesion.
- Digital subtraction angiography(DSA)
AMLs are hypervascular lesions demonstrating characteristic features as:
-sharply well-defined hypervascular mass with tortuous vessels and aneurysms giving the "sunburst" appearance on arterial phase(Fig.
4);
-whorled"onion peel"appearance of peripheral vessels on venous phase.
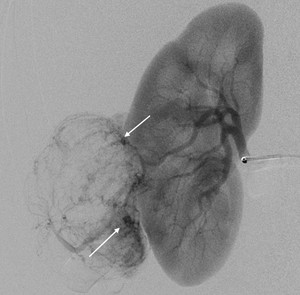
Fig. 4: Anteroposterior view of DSA of the right renal artery showing hypertrophic, tortuous and branching arterial vessels with appearance of the “sunburst sign”. Some micro-aneurysm are noted within the AML (arrows).
B.2.Fat poor AML
I.Hyperattenuating AML
US cannot define AMLs with minimal fat component,
so is not very sensitive for subtype diagnosis and moreover,
homogeneously isoechoic to renal parenchyma evidence is often displayed.
Because of the abundant smooth muscle component,
on CT scan these lesions are[7]:
-hyperdense on NECT(>45 HU~smooth muscle) with a hypodense rim;
-homogeneous and prolonged enhancing(Fig.
5).
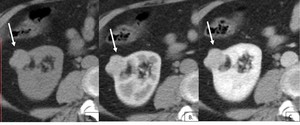
Fig. 5: Fat-poor AML, hyperattenuating subtype: transverse NECT 5mm section (A) demonstrates a hyper-attenuating (50HU) exophytic right renal mass (arrow) and a small region with fat attenuation (*). The mass shows prolonged enhancement on corticomedullary (B) and nephrographic phase image (C).
On MRI scan, they also behave similarly to smooth muscle:
-hypointense on T2/T1-w images;
-there are no regions that show signal loss on FS pulse sequences and no chemical shift suppression;
-homogeneously enhancement.
These findings are not specific enough so biopsy of the renal mass may be indicated.
II.Isoattenuating AML
This subtype is rare and the fat cells are too few in a single area to be detected with imaging,
but diffusely scattered among the smooth muscle and vessel components.
US: isoechoic/slightly hyperechoic(Fig.6).
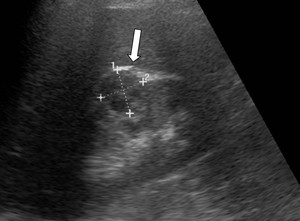
Fig. 6: Kidney US showing a slight heterogeneous nodular lesion but relative echogenic compared to renal parenchyma (white arrow) in the right kidney (HP: fat poor AML).
CT attenuations that are close to renal parenchyma on NECT,
between −10 and 45 HU(1.5-3 mm thin sections) and enhances homogeneously(Fig.
7)
MRI[8]:
- T2-hypointense;
- may or may not show signal loss on fat-suppressed pulse sequences depending on the amount and distribution of fat cells in the lesion;
- can show chemical shift suppression(the scattered,
sparse fat cells)
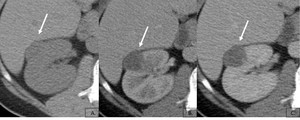
Fig. 7: Well defined soft tissue exophytic lesion (arrow) showing attenuation close to renal parenchyma at NECT (A) and homogeneous minimal maintained enhancement on corticomedullary (B) and nephrographic phase image (C). No fatty pixels were detected. A laparoscopic tumorectomy was performed, with an AML histological diagnosis.
B.3.Epithelioid AML
EAML is an extremely rare form of AML capable of aggressive/malignant clinical behavior.
Radiologically they have a variable appearance,
from homogeneous/heterogeneous solid masses (with intratumoral hemorrhage or necrosis) to complex cystic lesions(Fig.
8).
Mostly are large lesions hyperattenuating on NECT(40-90 HU) and T2-hypointense due to their epithelioid muscle component and may present an infiltrative component due to their aggressive nature[9].
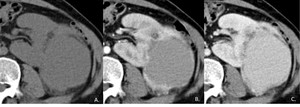
Fig. 8: Confirmed EAML: axial NECT (5mm sections) shows a large mass (A) on the left kidney, with peripheral enhancement on corticomedullary (B) and heterogeneous on nephrographic phase image (C).
C.COMPLICATIONS
AML do not usually present any complications.
However,
lesions that carry the risk of spontaneous hemorrhage(Fig.
9) can be symptomatic(flank pain and gradual loss of renal function) and need treatment,
which includes arterial embolization or surgical excision.
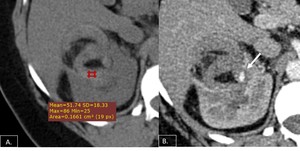
Fig. 9: Axial NECT (A) demonstrating fat containing lesion in the right kidney with surrounding high density hemorrhage. Axial post contrast CT (B) showing a small aneurysmal vessel supplying the AML(arrow).
Angio-embolization is the first line treatment for tumors receiving blood supply by a single arterial branch(Fig.
10),
particularly in patients with high operative risks(multiple comorbidities),
is a minimally invasive procedure with the added advantage of preventing peri-procedural complications[10].Its main purpose is to occlude permanently the angiogenic component of the tumor preserving functional renal parenchyma.
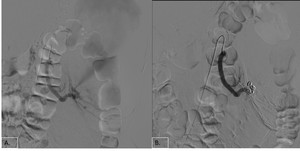
Fig. 10: Left renal angiogram demonstrates arterial branches supplying the AML (A). Multiple coils were used to achieve complete stasis (B).
Apart from the traditional criteria (tumor size>4cm or intratumoral aneurysm>5mm),
the risk of AML rupture should be based on a more comprehensive risk assessment system including also vascularity grading,
pregnancy,
coagulopathy,
trauma,
hormone level and comorbidity with TSC/LAM[11].
Hereditary form:AMLs associated to TSC
TSC is a rare hereditary disease characterized by benign tumors that
develop in multiple organs,
as skin (angiofibroma),
brain (cortical and subependymal tubers),
kidneys,
liver,
lungs(lymphoangioleiomyomatosis) and heart(rhabdomyoma)[12].
The most common renal manifestations of TSC are AMLs and cysts,
which in time can cause chronic renal disease.
The presence of two or more renal AML is a major diagnostic criterion for a TSC diagnosis.
They are usually asymptomatic but tend to grow and bleed more often compared to sporadic AMLs[13].
US is a useful initial approach to determine whether the lesions are cystic/solid,
hyperechoic and homogeneous(Fig.11).
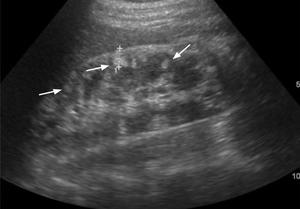
Fig. 11: Kidney US showing multiple small hyperechogenic nodular masses (arrows) in the right kidney, suggestive for AMLs on a patient known with TSC.
Typical CT findings are non-calcified cortical nodules with fatty attenuation±cysts.
Usually they are multiple,
bilateral and lead to extensive replacement and distortion of kidney(Fig.12)
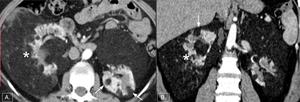
Fig. 12: Axial (A) and coronal (B) corticomedullary phase CT scan shows multiple well-defined tumors with fat attenuation (arrows) that replace and displace the renal parenchyma bilaterally (*) on a patient knwon with TSC.
MRI
- high signal intensity in spin echo sequences(T1-w and T2-w) with signal loss using selective FS technique;
- drop of signal-intensity in out-of-phase GRE sequences with respect to images in-phase due to intracytoplasmic fat content(Fig.
13)
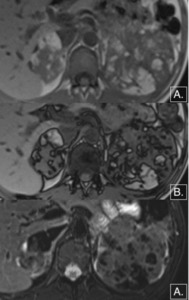
Fig. 13: MRI axial sections showing multiple, bilateral focal lesion with predominantly high signal intensity on T1 in-phase (A) and drop of signal in out-of- phase (B) sequence and fat suppression on T2-w FS (C), confirming the fat component of the lesion which lead to extensive replacement and distortion of kidney
D.DIFFERENTIAL DIAGNOSIS
1.RETROPERITONEAL LIPOSARCOMA
Perirenal liposarcoma and large exophytic renal AML are two retroperitoneal masses that contain adipose tissue whose imaging appearances may be so similar[14].
On the CT[15] scan features that can suggested a retroperitoneal liposarcoma are:
- anteriorly displacement of a compress/distort kidney;
- enhanced intratumoral nodules and multiple thick septae(Fig.14);
- evidence of local invasion.
While for exophytic AML more suggestive are:
- renal parenchymal defect at the site of tumor origin(“the beak sign”);
- dilated(aneurysms) or bridging intratumoral vessels;
- intratumoral or perirenal bleeding.
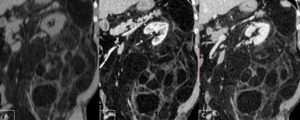
Fig. 14: Coronal NECT (A) shows a large fatty retroperitoneal mass which surrounds the left kidney and displacing it but that there is no defect in the parenchyma. There is haziness within the fat, a finding characteristic liposarcoma. On corticomedullary (B) and nephrographic (C) phase note the multiple thick septae. (arrows)
2.RENAL CELL CARCINOMA(RCC)
The most common primary renal malignancy in adults[16].
The tumor is often encapsulated,
heterogeneous and has two major components: solid(hypervascularised tissue) and necrotic(avascular tissue).
On US, RCC may be hyperechoic (due to fat necrosis) and can present hypoechoic halo and intratumoral cysts.
CT scans usually show an isoattenuating mass to the renal parenchyma on NECT which may contain hypo/hyperattenuating areas(hemorrhage or necrosis) and cause distortion of the renal contours.
Rarely may contain calcifications(suggestive for RCC) or fatty components.
On CECT:
- the lesion is hypervascular (enhances>15 HU) during the arterial phase and hypoattenuating(wash-out) on NP(Fig.
15);
- larger tumors with necrotic components show heterogeneous enhancement;
- perinephric engorged vessels are a well-known sign of malignant lesions --> neovascularity;
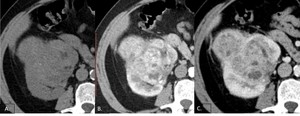
Fig. 15: axial NECT scan shows a bulging mass on the right kidney isoattenuating to renal parenchyma. On corticomedullary phase (B) the lesion is hypervascular, nonhomogeneous, with small areas of necrosis (*) and hypoattenuating on nephrographic phase (C).
There often is renal vein invasion(the thrombus may extend into the inferior vena cava) with a vascular thrombus.CT is frequently used to both diagnose and stage renal cell carcinomas.
MRI is excellent at imaging the kidneys and locally staging tumors,
and able to suggest the likely histology,
on the grounds of T2 differences.
Another useful finding is a tumor/kidney SI ratio>1.2 on T2FS images,
which indicates 100% specificity for RCC.
- T1:often heterogeneous due to necrosis,
hemorrhage and solid components
- T2:hyperintense
- T1 + CM:shows similar behavior to CECT.
3.ONCOCYTOMA
Renal oncocytoma is a highly cellular benign epithelial tumor,
which may reach enormous size.
The imaging characteristics of oncocytoma and RCCs overlap,
and differentiating them is not always possible with US,
CT or MRI[17].
On NECT:
- solid and well-demarcated mass slightly iso-hyperdense compared to renal parenchyma;
- rarely can present calcification.
On CECT:
- heterogeneous enhancement with a fibrous stellate non-enhancing scar central/eccentric(Fig.16);
- some lesions may present a segmental inversion of enhancement or spoke wheel pattern.
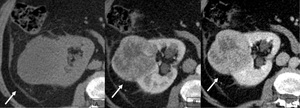
Fig. 16: Axial NECT image shows a mass bulging contour of right kidney (A). Corticomedullary phase (B) image shows well-defined round mass with two well-differentiated segments: periphery enhancement and less enhanced central scar. On nephrographic phase (C) the periphery remains highly enhanced.
MRI scans show a well-defined,
homogeneous masses,
iso-hypointense to the renal cortex on non-enhanced T1-w and isointense to slightly hypointense on T2-w images.
The presence of a central stellate scar,
the absence of adenopathy/ vascular invasion,
should suggest the diagnosis,
although there is some overlap with RCCs.
Therefore,
in the absence of previously documented oncocytoma or known stability of the lesion,
surgery is generally performed.
4.The differential diagnosis of fat-poor AML includes also:
- Wilms tumor;
- adrenal myelolipoma;
- renal lymphoma;
- metanephric adenoma.
E.DISCUSSION
Imaging evaluation of a renal mass
The accurate diagnosis of a renal mass is depend is dependent on many factors,
including the nature of the imaging findings and correllations with clinical/pathological results,
the quality of the examination,
the experience of the radiologist and the exclusion of condition that can mimic a renal neoplasm.
1. The suspicion of fat in a renal mass,
detected by US,
implies further imaging methods.
2. A renal protocol MDCT scan is recommnded which includes four sets of images: non-enhanced image followed by triphasic CECT.
3. If the pacient does not tolerate iodinated contrast agents,
MRI is an alternative modality for lesion characterization.
Non-enhanced images are required first,
followed by gadolinium contrast-enhanced images at a series of time interval after CM injection.
4.
If the diagnose of AML is uncertain a percutaneous biopsy should be performed.
What would the clinician wants to know:structured report
- type of the lesion–surgical/non-surgical
- number of lesions – single/multiple; uni/bilateral
- dimensions (axial/coronal/AP-diameters)
- lesion structure: presence of intratumoral fat-attenuating areas
(predominant fat) or heterogeous(calcification/necrosis/tissular nodules)
- presence complications signs: intra/peritumoral hemorrhage
- associated findings /or incidentaloma
- recommendations: e.g.
follow-up studies

 in the upper pole of the right kidney, suggestive for classical AML.")
 shows a right kidney mass with fat attenuation (arrow) associated with a renal parenchymal defect, no enhancement on corticomedullary (B) and nephrographic phases (C) and bridging vessels(arrow head).")
 and drop of signal in out-of-phase (B) sequence and fat suppression on T2-w FS, confirming the fat component of the lesion.")
.")
 demonstrates a hyper-attenuating (50HU) exophytic right renal mass (arrow) and a small region with fat attenuation (*). The mass shows prolonged enhancement on corticomedullary (B) and nephrographic phase image (C).")
 in the right kidney (HP: fat poor AML).")
 showing attenuation close to renal parenchyma at NECT (A) and homogeneous minimal maintained enhancement on corticomedullary (B) and nephrographic phase image (C). No fatty pixels were detected. A laparoscopic tumorectomy was performed, with an AML histological diagnosis.")
 shows a large mass (A) on the left kidney, with peripheral enhancement on corticomedullary (B) and heterogeneous on nephrographic phase image (C).")
 demonstrating fat containing lesion in the right kidney with surrounding high density hemorrhage. Axial post contrast CT (B) showing a small aneurysmal vessel supplying the AML(arrow).")
. Multiple coils were used to achieve complete stasis (B).")
 in the right kidney, suggestive for AMLs on a patient known with TSC.")
 and coronal (B) corticomedullary phase CT scan shows multiple well-defined tumors with fat attenuation (arrows) that replace and displace the renal parenchyma bilaterally (*) on a patient knwon with TSC.")
 and drop of signal in out-of- phase (B) sequence and fat suppression on T2-w FS (C), confirming the fat component of the lesion which lead to extensive replacement and distortion of kidney")
 shows a large fatty retroperitoneal mass which surrounds the left kidney and displacing it but that there is no defect in the parenchyma. There is haziness within the fat, a finding characteristic liposarcoma. On corticomedullary (B) and nephrographic (C) phase note the multiple thick septae. (arrows)")
 the lesion is hypervascular, nonhomogeneous, with small areas of necrosis (*) and hypoattenuating on nephrographic phase (C).")
. Corticomedullary phase (B) image shows well-defined round mass with two well-differentiated segments: periphery enhancement and less enhanced central scar. On nephrographic phase (C) the periphery remains highly enhanced.")