ECR 2019 / C-2578
Diagnostic Reference Levels of the combined whole-body PET/CT examinations in a large territory hospital of Greece
Congress:
ECR 2019
Poster Number:
C-2578
Type:
Scientific Exhibit
Keywords:
Molecular imaging, Radiation physics, Radioprotection / Radiation dose, PET-CT, Dosimetry, Quality assurance
Authors:
A. Samartzis1, A.-A. Foteina2, E. Tzampazidou2, V. Chatonidis2, N. Bertsekas2, I. E. Datseris2; 1Ilioupoli/GR, 2Athens/GR
DOI:
10.26044/ecr2019/C-2578

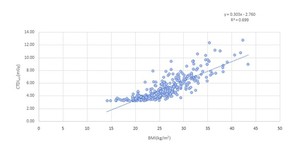
Fig. 1:
Distribution of CTDIvol values.

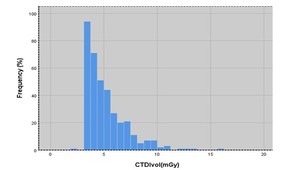
Fig. 2:
Histogram of CTDIvol values for PET/CT whole body examinations.

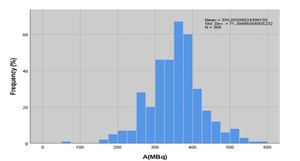
Fig. 3:
Histogram of injected FDG activity.