1) Median Arcuate Ligament Syndrome
Median arcuate ligament syndrome is also known as celiac artery compression syndrome and Dunbar syndrome.
It was first described by Hajola in 1963 and results from an anatomical compression of the proximal celiac trunk by the diaphragmatic crura (Fig.
1) .
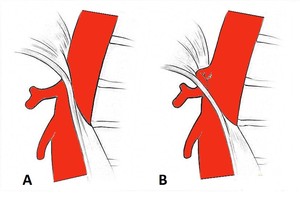
Fig. 1: Schematic drawing of the normal anatomy of the relationship between the median arcuate ligament and the celiac axis (A) and of anatomical compression of the proximal celiac trunk by the median arcuate ligament, seen in the Dunbar syndrome (B).
The median arcuate ligament is a tendinous band that connects the right and left diaphragmatic crura and crosses over the aorta,
usually above the origin of the celiac artery,
at the level of the L1 vertebra.
In 10-24% of cases,
the ligament passes anterior to the celiac artery,
due to a more cephalad origin of the vessel or a low insertion point of the median arcuate ligament,
resulting in extrinsic compression of the proximal celiac trunk and nearby structures.
This compression can be accentuated during expiration because of the superior movement of the celiac artery.
It is most commonly detected in young and thin women,
between the ages of 20 and 40.
Most patients with celiac compression have no symptoms,
being crucial the correlation between imaging and clinical findings.
Studies have shown that 10% to 50% of healthy subjects have isolated compression of the celiac axis during expiration,
not being a clinically relevant event.
When symptomatic,
these individuals may develop nausea,
diarrhea,
weight loss or chronic post-prandial epigastric pain,
which relieves in orthostatic position and worsens in the supine position.
At physical examination,
an epigastric bruit that varies with respiration may be audible.
Diagnosis is challenging and is based on the presence of symptoms,
typical imaging findings,
and exclusion of other causes.
CT and conventional angiography are the gold standard imaging modalities for the evaluation of the relationship between the median arcuate ligament and the celiac axis.
These modalities,
as well as MR angiography demonstrate,
on sagittal views,
a superior indentation on the proximal celiac artery that has a characteristic “J” or hook shape,
usually at around 5mm from celiac trunk ostium (Fig.
2).
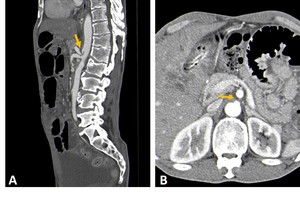
Fig. 2: Contrast-CT abdominal sagittal (A) and axial (B) images with characteristic findings of median arcuate ligament syndrome. There is a superior indentation on the proximal celiac artery (yellow arrows) that has a characteristic “J” or hook shape, with a celiac trunk post-stenotic ectasia.
This finding and the young age of the patient differentiate the compression caused by the median arcuate ligament from atherosclerotic stenosis.
Since the superior indentation of the celiac trunk can be identified in healthy people,
especially at expiration,
imaging should be performed at the end of inspiration,
which is when the celiac axis is in a more caudal position.
Therefore,
CT angiography in both deep inspiration and deep expiration allows a comprehensive evaluation of the dynamic changes in celiac artery diameter with respiration.
Additional features that may be observed in cross-section imaging are post-stenotic dilatation,
prominent collaterals,
and thickening of the median arcuate ligament of greater than 4 mm.
Doppler ultrasound can also be a useful diagnostic tool.
It characteristically shows increased flow velocities over the compressed segment of the celiac artery greater than 200 cm/s during deep expiration,
with a sensitivity and specificity of 75% and 89%,
respectively.
2) Superior mesenteric artery syndrome
Superior mesenteric artery syndrome (SMAS) was first described by Rokitansky in 1861 and is also known as Wilkie Syndrome and Cast syndrome.
It is caused by vascular compression of the third portion of the duodenum between the aorta and superior mesenteric artery (SMA),
resulting in intermittent duodenal obstruction.
The SMA courses anteriorly and inferiorly forming an acute angle with the aorta.
The third portion of the duodenum crosses between the aorta and the proximal SMA and is surrounded by mesenteric adipose tissue,
which functions as a natural fatty cushion,
preventing extrinsic compression by the SMA and helping to maintain a wide aortomesenteric angle (AMA) and aortomesenteric distance (AMD) (Fig.
3).
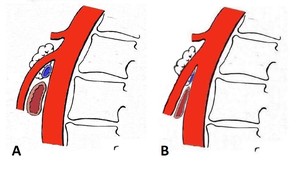
Fig. 3: Schematic drawing of the mesoaortic space’s normal anatomy (A) and of a steep angulation of the superior mesenteric artery to the aorta, which may predispose to nutcracker syndrome and superior mesenteric artery syndrome (B).
Conditions that induce rapid and severe weight loss (e.g,
anorexia nervosa),
corrective scoliosis surgery and anatomic variants,
such as an insertional variation of the ligament of Treitz or low origin of the SMA,
are risk factors for SMAS.
SMAS is more common in female children and adolescents than in males and has a prevalence of 0.01-0.3% based on fluoroscopy.
Symptoms include postprandial or intermittent epigastric pain,
which relieves in the left lateral decubitus position,
and features of duodenal obstruction such as vomiting,
nausea,
and anorexia.
The diagnosis of SMAS is based on clinical symptoms and radiologic evidence of obstruction.
CT performed with contrast is the diagnostic test of choice for this syndrome.
It allows evaluation of the mesoaortic vascular anatomy,
defines the duodenal compression point,
the presence of proximal dilatation,
and excludes other causes of obstruction (Fig.
4).
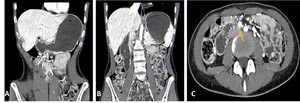
Fig. 4: Contrast-CT abdominal sagittal (A and B) and axial (C) images showing dilatation of the stomach(*) and first and second(+) portions of the duodenum, with extrinsic compression of the third portion of the duodenum by the superior mesenteric artery (yellow arrow).
An AMA of less than 22° and an AMD of less than 8 mm are compatible with SMAS,
being the normal AMD typically between 10 and 28 mm.
The normal AMA was described between 38° and 56° however,
some new studies claim that 90° is a more accurate value (Fig.
5).
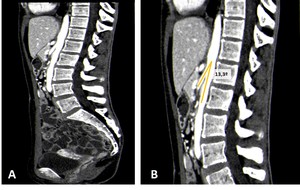
Fig. 5: Contrast-CT abdominal sagittal images (A and B) showing a steep angulation of the superior mesenteric artery to the aorta, with an aortomesenteric angle of 13,3º, in a patient with a superior mesenteric artery syndrome.
Fluoroscopy can also demonstrate a dilated proximal duodenum and stomach,
a vertical extrinsic impression on the third portion of the duodenum,
antiperistaltic waves proximal to the obstruction,
delayed gastroduodenal emptying,
and relief of obstruction with postural change (Fig.
6 and 7).
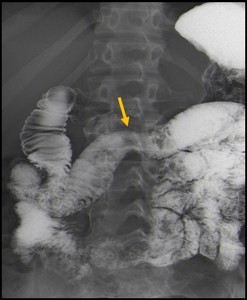
Fig. 6: Barium frontal gastroduodenal image showing dilatation of the proximal duodenum, with an extrinsic compression in the midline of the 3rd part of the duodenum caused by the superior mesenteric artery (yellow arrow).
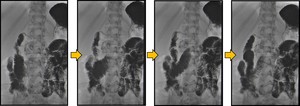
Fig. 7: Sequence of images from a gastroduodenal study with barium showing antiperistaltic waves and contrast reflux proximal to the compression of the third portion of the duodenum caused by the superior mesenteric artery, in a patient with Wilkie syndrome.
3) Nutcracker Syndrome
The nutcracker syndrome refers to the anatomic compression of the left renal vein.
It can be anterior,
if occurs between the superior mesenteric artery and the aorta,
or posterior,
if the left renal vein has a retroaortic course,
between the aorta and the vertebral body.
A short AMD,
which is caused by a steep angulation of the superior mesenteric artery to the aorta,
can predispose to this syndrome (Fig.
3).
It is often associated with superior mesenteric artery syndrome and with a thin or asthenic body.
Therefore,
conditions associated with considerable and rapid weight loss,
with loss of retroperitoneal fat,
may predispose to compression of the left renal vein.
The prevalence of nutcracker syndrome is unknown,
because of the variability of symptoms and the absence of consensus regarding diagnostic criteria; however,
there is a slightly greater young female predilection,
usually in the 3rd–4th decade of life,
and it is more common on the left side.
The most common symptom is intermittent mild microhematuria to severe gross hematuria,
which is caused by rupture of fragile varices into the collecting system.
They also may have orthostatic proteinuria,
left flank pain,
left-sided varicoceles in males and left-sided vulvar and pelvic varices in females.
Symptoms are often aggravated by physical activity.
It is important to note that in the absence of clinical findings,
the renal vein compression is usually developmental,
therefore it represents the nutcracker phenomenon.
Nutcracker syndrome remains a clinical diagnosis and should be made only when characteristic symptoms are present.
The diagnosis of nutcracker syndrome requires a high index of suspicion and is often made by exclusion.
CT and MR imaging with contrast allow evaluation of the mesoartic anatomy,
the focal compression of the left renal vein and the distance and the angle formed between the superior mesenteric artery and aorta.
An AMA of less than 41° is 100% sensitive and 55.6% specific for nutcracker syndrome (normal angle measures approximately 90°).
The beak sign can also be seen in the nutcracker syndrome and has a sensitivity of 91.7% and specificity of 88.9%.
It consists of an abrupt narrowing,
associated with proximal dilatation of the left renal vein (Fig.
8).
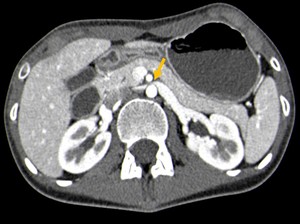
Fig. 8: Contrast-CT abdominal axial image showing the beak sign (yellow arrow), an abrupt narrowing of the left renal vein, associated with proximal dilatation, in a patient with nutcracker syndrome.
Additional features that may be observed in cross-section imaging are prestenotic dilatation,
hilar,
periureteric,
and pelvic varices and dilated gonadal veins (Fig.
9).
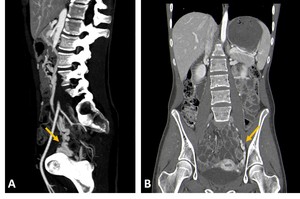
Fig. 9: Contrast-CT abdominal sagittal (A) and coronal (B) images demonstrating signs of pelvic congestion (pelvic varices) in a patient with nutcracker syndrome (yellow arrows).
Doppler imaging can provide hemodynamic information and has a sensitivity of 78% and a specificity of 100% for nutcracker syndrome.
It allows the measurement of the renal vein diameter and the flow velocity of the vein stenosis,
which should exceed 100 cm/sec.
A peak velocity ratio of more than 5,
measured at the renal hilum and the level of aortomesenteric junction,
has a sensitivity and specificity of 100% and 90% respectively for this syndrome (Fig.
10).
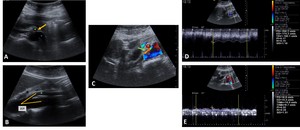
Fig. 10: B-mode ultrasound evaluation (transversal (A) and longitudinal (B) images) demonstrating an abrupt narrowing (yellow arrow) of the left renal vein(*), by the superior mesentery artery(+) and a reduced aortomesenteric angle (21º), in a patient with nutcracker syndrome. Color Doppler ultrasound evaluation (C) showing aliasing at the site of compression (green arrow). Spectral Doppler evaluation (D and E) demonstrating elevated peak systolic velocities (PSV) in the left renal vein stenosis (180 cm/s) and a 13-fold increase in PSV compared to the proximal segment.
The definitive diagnostic test for nutcracker syndrome remains the retrograde venography; however,
it has the inherent drawback of being invasive.
It allows the determination of the renocaval pressure gradient,
which when greater than 3 mm/Hg is compatible with this syndrome.
4) May-Thurner Syndrome
May-Thurner syndrome was first described by May and Thurner in 1957,
and is also known as iliac vein compression syndrome and Cockett syndrome.
It refers to a chronic compression of the left common iliac vein by the overlying right common iliac artery against the fifth lumbar vertebra (Fig.
11).
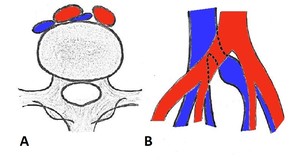
Fig. 11: Axial (A) and coronal (B) schematic drawings demonstrating compression of the left common iliac vein by the overlying right common iliac artery against the fifth lumbar vertebra.
May-Thurner syndrome is diagnosed in 2-5% of people undergoing evaluation for chronic venous disorders and contribute to 18-49% of cases of left-sided deep venous thrombosis.
It generally affects young women in the 2nd to 4th decades of life,
usually after prolonged immobilization or pregnancy.
In addition to the physical compression of the common iliac vein caused by the common iliac artery,
it is believed that intrinsic factors,
such as the formation of internal webs or bands (spurs),
secondary to local intimal hypertrophy,
play an active role in the pathogenesis of this syndrome.
Iliocaval compression may be asymptomatic.
When the compression is associated with symptoms,
left lower extremity swelling is the most frequent one,
which may manifest acutely due to left-sided iliofemoral vein thrombosis or may be chronic due to venous congestion without underlying thrombosis.
Varicose veins,
venous eczema,
hyperpigmentation,
exertional pain and venous ulcers in the left leg,
as well as pulmonary emboli,
can also be observed.
CT with contrast is widely available and reliably shows the iliac vein compression,
the extent of iliofemoral vein thrombosis and is useful to rule out other causes of venous compression (Fig.
12 and 13).
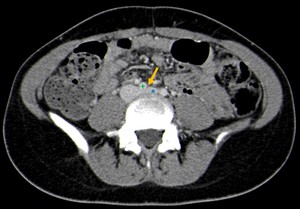
Fig. 12: Contrast-CT abdominal axial image showing left common iliac vein(*) compression (yellow arrow), by the right common iliac artery(+), without associated thrombosis.
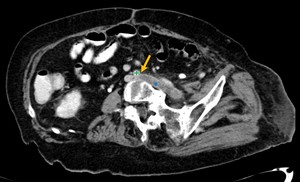
Fig. 13: Contrast-CT abdominal para-axial image showing left common iliac vein compression (yellow arrow), by the right common iliac artery(+), associated with iliac vein thrombosis(*), in a patient with May-Thurner Syndrome.
Doppler ultrasound is most often used in screening for deep vein thrombosis in the left common iliac vein; However,
in about 20% of the general population,
the iliac vessels may not be adequately evaluated,
especially if the patient is obese or there is too much bowel gas.
Ascending iliac contrast venography is the reference standard for the diagnosis of May-Thurner syndrome,
nevertheless,
it is invasive,
time-consuming and is also suboptimal for visualizing the central veins.
It demonstrates the venous compression,
allows hemodynamic evaluation by measuring pressure gradients and shows additional findings such as tortuous venous collaterals.
Follow-up is not usually necessary unless the patient is symptomatic from the process.
5) Retrocaval ureter
Circumcaval ureter,
also known as retrocaval ureter,
is characterized by an abnormal ureter pathway surrounding the inferior vena cava (IVC) and is considered an anomaly of the development of this vessel.
In this condition,
the infrarenal IVC develops from the right posterior cardinal vein,
which lies laterally to the ureter.
As a result,
part of the right ureter passes posterior and medial to the inferior vena cava (Fig.
14).
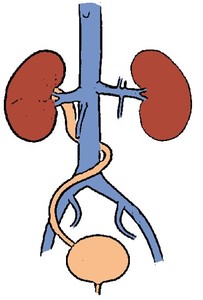
Fig. 14: Retrocaval ureter, schematic drawing.
It is a rare congenital anomaly,
which is 3 to 4 times more common in men and involves the right ureter in 99% of cases.
It can occur in the left when associated with situs inversus or duplication of IVC.
Retrocaval ureter is usually asymptomatic.
Depending on the degree of compression,
patients may develop flank pain,
recurrent urinary tract infections,
haematuria,
and hypertension,
which frequently occur in the third and fourth decades of life.
Hydronephrosis can also be seen.
The gold standard for its diagnosis is CT which gives details on the ureter morphology,
its path behind the IVC and the presence of proximal dilatation (Fig.
15).
Ultrasound can demonstrate hydronephrosis,
but it poorly delineates the ureter.
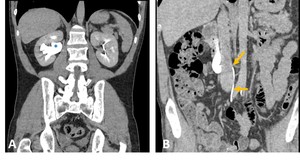
Fig. 15: CT Urography coronal (A) and para-coronal (B) images demonstrating a retrocaval ureter, with its posterior and medial portions to the inferior vena cava (yellow arrows), with associated hydronephrosis(*).
6) Ureteropelvic Junction Obstruction
Ureteropelvic junction (UPJ) obstruction is characterized by a congenital partial obstruction at the junction of the renal pelvis and proximal ureter.
Its prevalence is less well defined in adults than in children and occurs in approximately one out of 20000 live births.
Multiples causes have been described,
including crossing vessels,
an aperistaltic ureteral segment,
insertional abnormalities,
an intrinsic luminal narrowing,
local collagen deposition and periureteral fibrosis secondary to recurrent urinary tract infection.
In some cases,
it can be idiopathic.
Aberrant vessel crossing anteriorly to the UPJ or proximal ureter is the most common extrinsic cause of UPJ obstruction (Fig.
16).
It can be a renal artery or vein that crosses the ureter transition point,
usually the lower pole segmental artery or vein.
It also may be a vessel that arises separately from the aorta,
iliac artery,
or IVC.
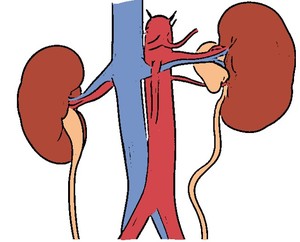
Fig. 16: Schematic drawing showing a left ureteropelvic junction obstruction caused by an acessory renal artery.
Patients can be asymptomatic or have flank pain,
hematuria,
renal stones,
urinary tract infections or pyelonephritis.
Pain may be intermittent and related to the intake of large volumes of fluid.
UPJ obstruction is characterized by a dilatation of the renal pelvis,
with a variable amount of dilatation of the calyceal system.
The distended extrarenal pelvis has a characteristic inverted teardrop morphology and the proximal ureter,
as it crosses over the crossing vessel,
has a hooked appearance.
Multidetector CT provides an excellent evaluation of crossing vessels,
with a reported positive predictive value of 100%.
The relationship of the vessels to the ureteric transition zone and the severity and morphology of the hydronephrosis are easily depicted with this imaging modality (Fig.
17).
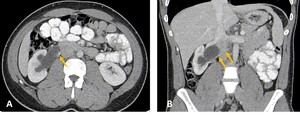
Fig. 17: Contrast-CT abdominal axial (A) and coronal (B) images showing a right ureteropelvic junction obstruction caused by an acessory renal artery (yellow arrows).
