Keywords:
Pathology, Neoplasia, Efficacy studies, CT, Urinary Tract / Bladder, Kidney, Abdomen
Authors:
M. H. Verussa1, F. M. A. Coelho2, M. FUKUMOTO1, B. A. Vento1, R. Gianordoli1, S. Horta1, F. I. Yamauchi1, P. Viana1; 1São Paulo/BR, 2São Paulo, São Paulo/BR
DOI:
10.26044/ecr2019/C-2630
Methods and materials
Patient selection
A retrospective study of patients followed on Department of Urology,
University of Sao Paulo Medical School General Hospital.
From January 2011 to December 2017,
all patients with renal mass who underwent a partial nephrectomy with previous CT were included in this present cohort.
CT imaging
All examinations were performed using a multidetector CT MDCT with 64 or 128 channels (Brillance,
Philips Healthcare or Aquilion CXL,
Toshiba).
For all patients,
the abdominal scan included precontrast and postcontrast phases (corticomedullary,
nephrographic and excretory phases).
Imaging evaluation
CT exams were examined by a second-year resident who was blinded to clinical,
pathologic,
and imaging findings.
Subjective and objective criteria were evaluated.
The subjective analysis consisted of classifying the renal mass in the followed features: shape (well-defined x ill-defined),
necrosis (present or absent),
hemorrhage (present or absent),
calcification (present or absent),
fat component (present or absent),
contrast enhancement pattern (hypovascular x hypervascular),
washout (present or absent),
collateral vessels into the lesion (present or absent) and collateral vessels around the lesion (present or absent).
The objective criteria evaluated were the renal mass attenuation on each postcontrast phase.
ROIs were placed on the most homogenous site of renal mass (and the most intense enhancement on postcontrast phases) (Figure 1).
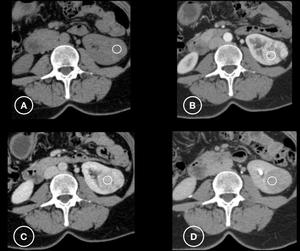
Fig. 1: CT scan on (A) precontrast phase, (B) arterial phase, (C) nephrographic phase and (D) excretory phase. ROIs are placed in the most homogeneous and intensely enhanced area of renal mass.
Statistical analysis:
Quantitative and qualitative analysis were compared by using the Dunnett test and Qui-Square test,
respectively P < .05 was regarded as indicating statistical significance.

 precontrast phase, (B) arterial phase, (C) nephrographic phase and (D) excretory phase. ROIs are placed in the most homogeneous and intensely enhanced area of renal mass.")