The use of abdominal CT in hypotensive patients with a range of acute abdominal and systemic disorders is increasing and evolving.
Abdominal CT may demonstrate several classic signs,
collectively known as the CT hypotension complex,
which is due to sympathetic nervous system activation as a protective physiological reaction.
The generic CT features are broadly divided into visceral and vascular manifestations and may be reversible on an early stage.
VISCERAL MANIFESTATIONS:
1.
Mural thickening and mucosal hyperenhancement of the small bowel
In the presence of hypovolemic shock,
some diffuse intestinal changes can be observed on CT,
such as wall thickening greater than 3 mm,
hyperenhancement of the mucosa greater than the psoas muscle and,
less frequently,
fluid-dilated intestinal loops (>2.5 cm) (Fig.
1).
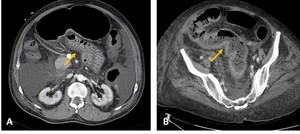
Fig. 1: Contrast-CT abdominal axial images showing shock bowel intestinal changes, such as wall thickening and mucosal hyperenhancement of the small (A) and large (B) bowells (yellow arrows).
These changes are the most common imaging features of the CT hypotension complex and are commonly known as "shock bowel".
It involves the small bowel more often than the large bowel.
In the hypovolemic state,
mucosal perfusion is preserved by an autoregulation system that prevents ulceration,
causing increased mucosal enhancement of the bowel.
The increased bowel wall permeability leads to interstitial leaks of water into the intestinal wall and accumulation of third-space fluids,
resulting in mural thickening.
The radiologist must be able to identify the main characteristics that differentiate intestinal shock from traumatic intestinal injury and intestinal ischemia.
In the case of intestinal trauma,
the major differences on imaging include lack of intense mucosal enhancement,
focal rather than diffuse abnormalities,
and signs of severe structural injury,
such as hematomas,
perforation or active extravasation of contrast.
Shock bowel and intestinal ischemia are more difficult to differentiate because the two may be similar on CT.
Bowel wall thickening and lumen distention may often be present in mesenteric ischemia,
but mucosal enhancement patterns are more variable in this condition.
2.
Adrenal Hyperenhancement
In the hypovolemic shock complex,
the adrenal glands may show intense,
early and persistent contrast enhancement,
with similar or higher Hounsfield Units (HU),
compared to inferior vena cava (IVC) (Fig.
2).
It is a frequent sign,
seen in up to 59% of patients with severe hypovolemia,
and is symmetrical in the majority of cases.
Adrenal glands play a central role in mediating the sympathetic response to hypovolemic shock and its hyperenhancement represents the 'fight or flight' autonomic mechanisms that redirect blood flow to vital organs.
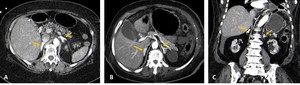
Fig. 2: Contrast-CT abdominal axial (A and B) and coronal (C) images demonstrating intense and persistente contrast enhancement (yellow arrows).
3.
Mucosal enhancement of the gallbladder
33% of patients with hypovolemic shock complex also demonstrate mucosal enhancement of non-thickened gallbladder walls (Fig.
3); however,
it is a non-specific sign.
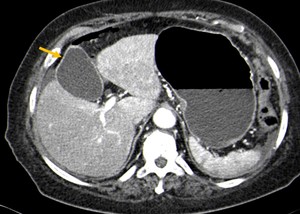
Fig. 3: Contrast-CT abdominal axial image demonstrating mucosal enhancement of gallbladder wall (yellow arrow), in a patient with hypoperfusion complex.
4.
Renal Hyperenhancement
Markedly intense and prolonged enhancement of kidneys is commonly observed in CT hypotension complex,
often with the absence of urinary excretion (Fig.
4).
Low blood pressure that causes intense efferent glomerular arteriolar vasoconstriction and tubular stasis is a possible explanation for this finding.
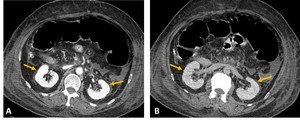
Fig. 4: Arterial-phase (A) and delayed-phase (B) contrast enhanced CT axial images demonstrating intense and persistent contrast enhancement of the kidneys, in a patient with hypoperfusion complex (yellow arrows).
However,
depending on the severity of hypovolemic shock,
kidney enhancement pattern can be variable.
Patchy areas of irregular contrast enhancement (bilateral striated nephrogram) have also be seen in systemic hypotensive patients (Fig.
5).
It could be related to segmental areas of vasoconstriction in the smaller renal vessels or due to preexisting focal renal disease.

Fig. 5: Contrast-CT abdominal coronal image demonstrating patchy areas of irregular contrast enhancement of the kidneys (bilateral striated nephrogram), in a patient with hypoperfusion complex (yellow arrows).
"Black Kidney" is characterized by complete hypoattenuation of the kidneys (<10HU) and can also be observed.
It is a late finding and has been associated with a poor prognosis.
5.
Spleen and liver hypoperfusion
Splenic arterial flow is highly sensitive to sympathetic stimulation and vasoconstriction and has no autoregulatory mechanism; therefore,
spleen could show extremely decreased enhancement in early-phase CT,
without any evidence of injury to the vessel or parenchyma as a result of hypoperfusion of the organ.
In these cases,
splenic enhancement is lower than hepatic enhancement by an average of 20 HU in adults (Fig.
6).
Decreased splenic contrast uptake seems to be a helpful predictor of poor prognosis.
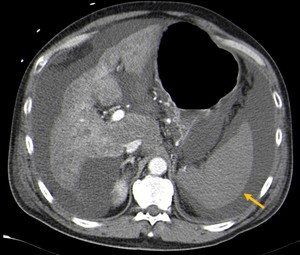
Fig. 6: CT abdominal axial image showing decreased spleen enhancement in early-phase CT, as a result of hypoperfusion of the organ (yellow arrow).
As hepatic arterial flow is autoregulated and is mixed with portal venous inflow,
liver hypoperfusion is rarely seen in hypovolemic patients; however,
the liver CT appearance may range from generalized hypodensity (25 HU less than the spleen) to a heterogenous/'nutmeg' like appearance (Fig.
7).
Intense enhancing intrahepatic vasculature surrounded by perivascular edema can also be seen.
False-positive interpretation could arise in patients with diffuse liver disease,
such as hepatic steatosis.
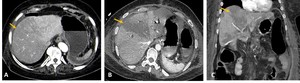
Fig. 7: Contrast-CT abdominal axial (A and B) and coronal (C) images demonstrating a heterogenous appearance of the liver, with hipodense areas of hipoperfusion (yellow arrows).
6.
Peripancreatic edema and pancreatic enhancement
Peripancreatic edema or fluid collection (<20 HU) can be observed both in patients with hypovolemia and pancreatitis.
In patients with hypovolemic shock,
these pancreatic manifestations have an incidence rate of up to 44% and can be explained by cytokine release as part of the systemic inflammatory response syndrome and pancreatic ischemia,
resulting in increased capillary permeability and loss.
Some clinical studies have reported hyperenhancement of the pancreas in the arterial phase of contrast-enhanced CT (20 HU greater than the liver and spleen) (Fig.
8),
whereas others have demonstrated hypoenhancement (20 HU lower than hepatic parenchymal enhancement).
Nowadays,
changes in the pancreatic enhancement remain controversial.
The difference in hypovolemic shock severity can be a possible explanation for these contradictions.
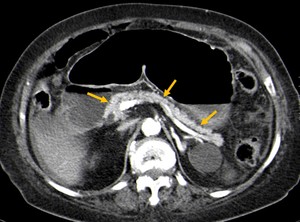
Fig. 8: Arterial-phase contrast enhanced CT axial image showing hyperenhancement of the pancreas (20 HU greater than the liver and spleen) in a patient with hypoperfusion complex (yellow arrows).
VASCULAR MANIFESTATIONS:
1.
Flattening of the inferior vena cava and the halo sign
Flattened or diminished IVC caliber (“slitlike IVC”) can be seen in 77–100% of patients with hypovolemic shock and has been defined as a reduced anterior-posterior diameter of the infrahepatic portion of the IVC,
usually less than 9 mm (Fig.
9).
The diagnosis is made when flattening is observed on at least three 10-mm-collimated scans (infrahepatic IVC,
at the level of the renal arteries and 2 cm below the level of the renal arteries),
since normal vena cava may appear flattened on a single abdominal section.
It is frequently associated with flattening of the renal veins,
and is explained by a reduced venous return and severe vasoconstriction.
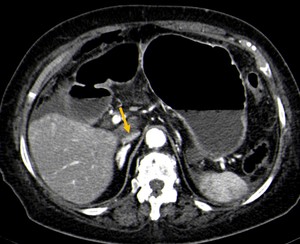
Fig. 9: Contrast-CT abdominal axial image demonstrating a flattened or diminished IVC caliber (“slitlike IVC”) in a patient with hypoperfusion complex (yellow arrow).
The halo sign is present when there is a circumferential accumulation of extracellular fluid surrounding the collapsed intrahepatic IVC,
which results in a zone of hypoattenuation,
usually less than 20 HU (Fig.
10).
This sign is seen most frequently at the corresponding level of the superior segments of the liver,
below the confluence of the hepatic veins and is thought to be related to a hyperpermeable state secondary to a systemic inflammatory response syndrome.
It has been reported in patients with hepatitis,
biliary cirrhosis and tumors blocking lymphatic drainage; therefore,
it is not specific for the CT hypotension complex.
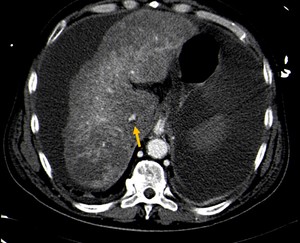
Fig. 10: Contrast-CT abdominal axial image showing the halo sign, a circumferential accumulation of extracellular fluid surrounding the collapsed intrahepatic IVC, in a patient with hypoperfusion complex (yellow arrow).
2.
Diminished caliber of the aorta
In 20 to 48% of patients with hypovolemia,
a small and densely enhancing aorta can be seen (Fig.
11); However,
it is not a specific sign of hypovolemia as it may also be seen in the healthy population.
An anteroposterior diameter smaller than 1.3 cm,
observed 2 cm above and below the origin of the renal arteries,
is considered reduced.
It is believed that this CT feature is caused by the arterial vasoconstrictive effects of angiotensin II,
which is mediated by the sympathetic nervous system and is secondary to hypotension in order to maintain blood pressure and perfusion in critical organs.
The decreased caliber of the superior mesenteric artery and vein,
with an abnormally dense lumen,
has also been reported.
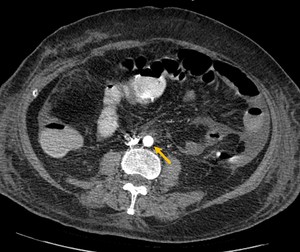
Fig. 11: Contrast-CT abdominal axial image demonstrating a small and densely enhancing aorta (<13mm), in a patient with hypoperfusion complex (yellow arrow).
