Keywords:
Thorax, Lung, Computer applications, CT, CT-Quantitative, Image manipulation / Reconstruction, Computer Applications-Detection, diagnosis, Segmentation, Technical aspects, Cancer, Tissue characterisation, Multidisciplinary cancer care
Authors:
E. Barabino1, G. Ficarra1, C. Genova1, M. Verda2, S. Casella3, S. Caprioli1, F. Grossi1, G. Cittadini1; 1Genoa/IT, 2Imperia/IT, 3Savona/IT
DOI:
10.26044/ecr2019/C-3625
Methods and materials
Patient Selection
We retrospectively evaluated baseline contrast-enhanced CT scans of 23 patients with Stage IIIb/IV NSCLC who were treated with a PD-1 Immune checkpoint Inhibitor (Nivolumab) from January 2015 to May 2017 at San Martino Policlinic,
University of Genoa.
All Patients received multiple lines of conventional chemotherapy and/or radiotherapy without clinical benefit before immunotherapy.
CT acquisition,
Reconstruction and Segmentation
CT scan data were acquired using the following parameters: 120 kVp,
100-300 mA,
5 mm slice thickness with 1.25 mm collimation.
CT scans were reformatted on axial plan with a 3 mm thickness on a dedicated workstation (Advanced Workstation 7,
GE Healthcare, Milwaukee,
Wisconsin,
USA) and each pulmonary lesion was manually segmented (Fig.1) on the slice with the largest cross-sectional area by a radiology resident experienced in CTTA blinded to clinical data.
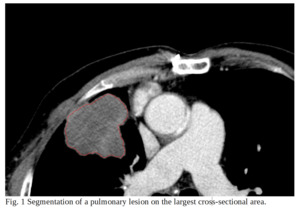
Fig. 1
Filtering and Texture Analysis
Three different Laplacian of Gaussian filters with a radius of 1.0,
2.0 and 3.0 were applied on each image and 273 texture features were subsequently extracted from both unfiltered and filtered images using dedicated software (MaZda,
version 4.6)[4,5,6].
Machine Learning
Our cohort of patients was split into two classes based on median overall survival (9.83 months).
Four predictive models were trained using k-nearest neighbors (k-NN) classifier (MATLAB R2018a,
Mathworks).
Principal component analysis (PCA) was applied to select textural features and remove redundant ones.
Leave-one-out cross-validation (LOOCV) was used to validate our predictive models.
Accuracy was calculated and receiver operating characteristic (ROC) curves were generated for each predictive model.

