ECR 2020 / C-02841
Right ventricular function assessment with four-dimensional phase-interpolated computed tomography
Congress:
ECR 2020
Poster Number:
C-02841
Type:
Scientific Exhibit
Keywords:
Performed at one institution, Cross-sectional study, Retrospective, Image verification, Technology assessment, Technical aspects, Comparative studies, Echocardiography, CT, Cardiac, Cardiology
Authors:
A. inakami1, K. miyauchi1, Y. katsuyama1, R. ogawa1, M. HABUCHI1, T. washio1, S. Takahashi2, A. Matsumoto3; 1hyogo/JP, 2Suita/JP, 3nagoya/JP
DOI:
10.26044/ecr2020/C-02841

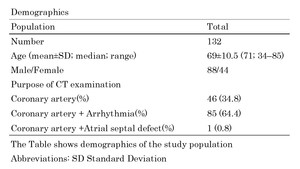
Table 1:
The Table shows demographics of the study population.

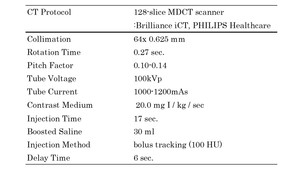
Table 2:
The Table shows CT protocol.

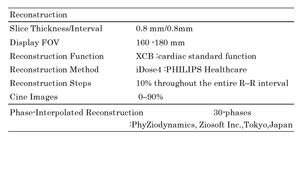
Table 3:
The Table shows reconstruction parameters.

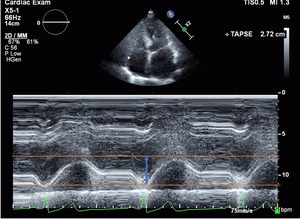
Fig. 2:
How to measure TAPSE with echocardiography.

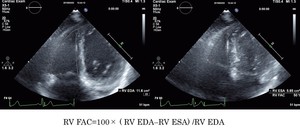
Fig. 3:
How to measure RVFAC with echocardiography.

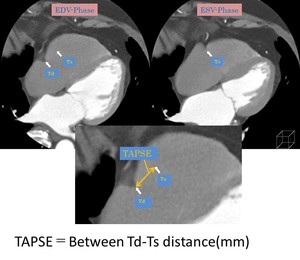
Fig. 4:
How to measure TAPSE with CT.

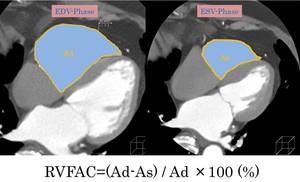
Fig. 5:
How to measure RVFAC with CT.