ECR 2020 / C-05646
Aortic disease assessment by Multidetector CT Aortogram
Congress:
ECR 2020
Poster Number:
C-05646
Type:
Educational Exhibit
Keywords:
Vascular, Arteries / Aorta, Cardiovascular system, Emergency, CT, CT-Angiography, CT-High Resolution, Computer Applications-3D, Computer Applications-Detection, diagnosis, Technical aspects, Acute, Aneurysms, Arteriosclerosis, Not applicable, Observational
Authors:
U. S. Umer, S. Alam, S. Ghulam ghaus, A. Nawaz Khan, S. Gul, H. Abid, N. Gul; Peshawar/PK
DOI:
10.26044/ecr2020/C-05646

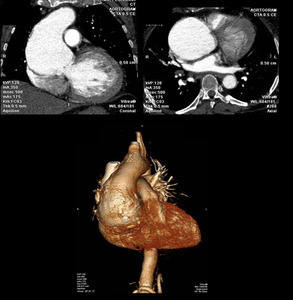
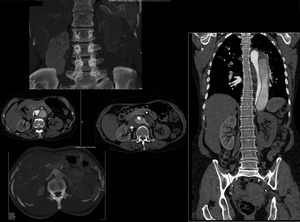
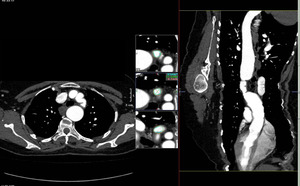
Fig. 2:
Curved coronal, axial reformat and 3D voulme rendered images showing large...

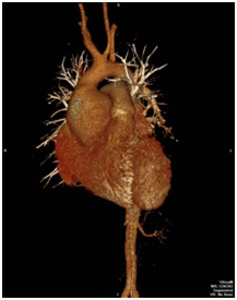
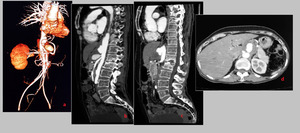
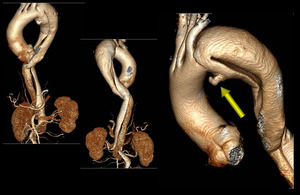
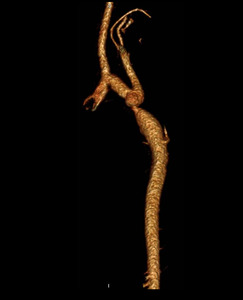
Fig. 3:
Volume rendered 3D reformatted image of CT Aortogram in a young patient...

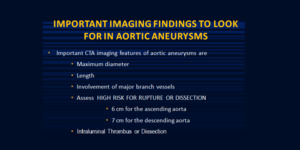
Fig. 4:
What to look for in Aortic aneurysm

Table 1

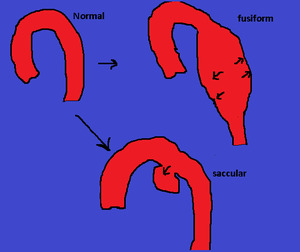
Fig. 5:
A fusiform aneurysm has symmetrical dilation involving the entire circumference...

Fig. 6:
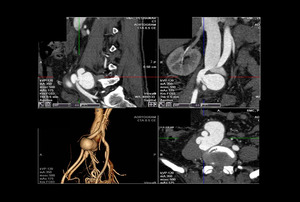
Saccular Aneurysm. Multiplanar reformatted 2D images of CT Aortogram showing...

Fig. 7:
Features of Aortic aneurysms

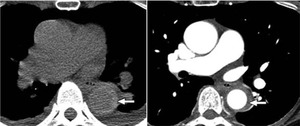
Fig. 8:
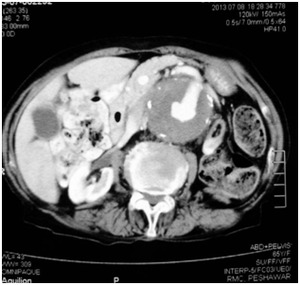
Axial CT image of a 65 years old female showing a large peripherally thrombosed...

Fig. 9:
Multiplanar CTA images of a 50 years old female with saccular mycotic aneurysms...

Fig. 10:
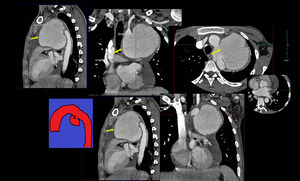
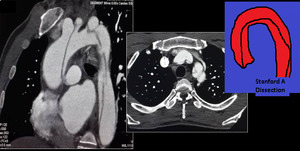
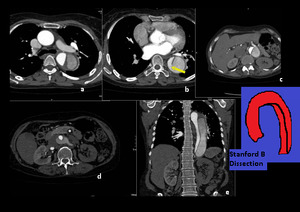
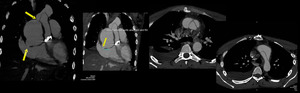
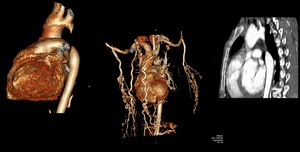
35 years old male with acute chest pain. Curved MPR images reveal STANFORD A...

Fig. 11:
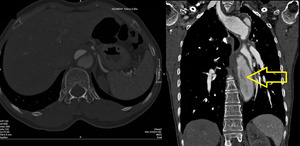
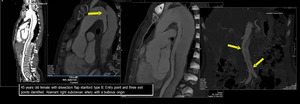
STANFORD B dissection. CTA images revealdDissection flap in descending aorta...

Fig. 12:
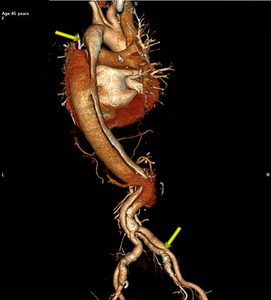
3D CT Aortogram showing Stanford B Dissection extending into iliac arteries.

Fig. 13:
Stanford B dissection in a 45 years old female. Cobweb sign seen in the false...
")
Fig. 14:
Aortic Dissection (Stanford B)

Fig. 15:
CT can measure the length of dissected segment, lumen involved, volume and...

Fig. 16:
CT can measure the length of dissected segment, lumen involved, volume and...

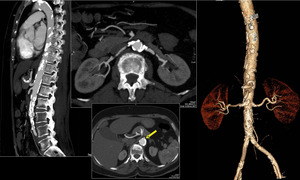
Fig. 17:
Stanford B dissection and left kidney being supplied by the false lumen with...

Fig. 18:
50-year-old woman with acute chest pain. Unenhanced low-dose CT image shows...

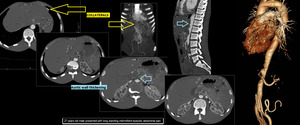
Fig. 19:
Aortitis. 27 years old male presented with long standing intermittent episodic...

Fig. 20:
Atherosclerosis. Calcified and non-calcified plaques are seen in aorta and its...

Fig. 21:
Aorto-iliac Occlusive disease. Severe atherosclerotic disease occluding the...

Fig. 22:
CT Aortogram of a 36 years old male showing Arteriovenous Fistula of right...

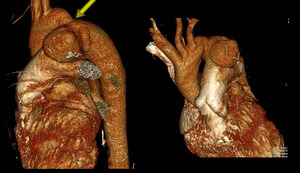
Fig. 23:
55-year-old female, post coarctation repair with chest pain. 3D volume...

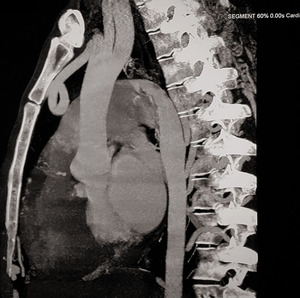
Fig. 24:
23 years old young male, post aortic valve replacement, presented with a large...

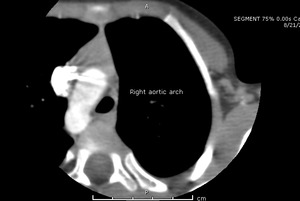
Fig. 25:
Right Aortic Arch.

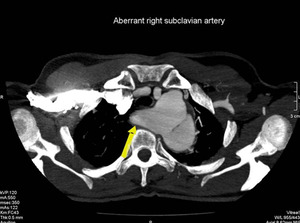
Fig. 26:
There is aberrant right subclavian artery with kommerell’s diverticulum.

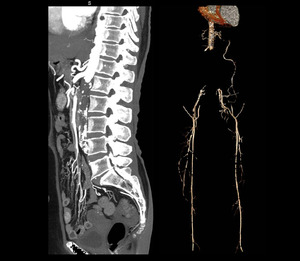
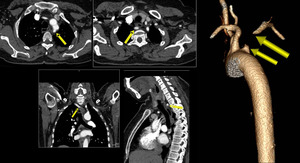
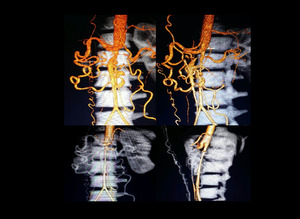
Fig. 27:
Multiplanar and 3D images of CT Aortogram showing severe thrombotic occlusion...
. Multiple collaterals are seen. MDCT workstation allows different post processed images viewed at once i.e. MPR, curved MPR, 3D surface rendered, 3D volume rendered without bone.")
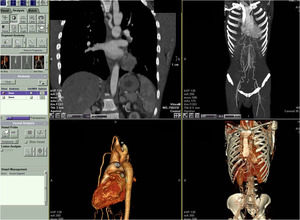
Fig. 28:
Aortic Coarctation (Ductal Type). Multiple collaterals are seen. MDCT...

Fig. 29:
Coarctation. CTA reformatted images. CT can measure the exact length of the...

Fig. 30:
Coarctation. 3D CTA image showing ductal type coarctation with pre-stenotic...
 with large PDA (persistent ductus arteriosum) and aneurysm of main pulmonary artery seen here as focal outpouching.")
Fig. 31:
Coarctation (arrow) with large PDA (persistent ductus arteriosum) and aneurysm...

Fig. 32:
Aortic Interruption. Descending aorta is being supplied by large PDA. No direct...

Fig. 33:
Aortic Interruption. Non-visualization of small segment of proximal descending...

Fig. 34:
CT Aortogram 3D surface rendered images showing midaortic syndrome seen as long...