ECR 2020 / C-05782
Delayed enhancing hepatic focal lesions on dynamic MRI: How to differentiate?
Congress:
ECR 2020
Poster Number:
C-05782
Type:
Educational Exhibit
Keywords:
Not applicable, Neoplasia, Education and training, Diagnostic procedure, MR, Oncology, Liver, Abdomen, Abdominal Viscera
Authors:
M. H. A. Mohammed Hassan1, S. H. I. Desoukey1, A. H. A. Mohamed2, F. E. Balah1; 1Giza/EG, 2Cairo/EG
DOI:
10.26044/ecr2020/C-05782

Fig. 4
 Cholangiocarcinoma: a guide for the nonspecialist. International Journal of General Medicine 12:13–23 International Journal of General Medicine 2019:12 13–23")
Fig. 5:
Morphologic classification of ICC.

Fig. 6:
Diagram demonstrating progressive delayed enhancement and secondary signs of...
Axial precontrast T1WI demonstrating a hypointense mass in segment VIII and IV of the liver.(B)Axial T2WI demonstrating a mildly hyperintense mass with central necrotic areas of higher T2 signal(asterisk),capsular retraction(arrow head)and minimal intrahepatic biliary dilation(dashed arrow).(C,D) Arterial and portal phases demonstrating a continuous ring of peripheral enhancement corresponding to active tumoral cells (red arrows). (E,F) Delayed phase demonstrating progressive central enhancement (white arrows) with no enhancement of the necrotic areas(asterisk). References: Department of diagnostic radiology, ALFA medical group, ALFA scan, Giza/EG")
Fig. 7:
Intrahepatic mass forming cholangiocarcinoma:(A)Axial precontrast T1WI...
Precontrast axial T1WI demonstrating a hypointense infiltrative mass in segments II and III of the left hepatic lobe (arrow).(B)and(C) Axial and coronal T2WI demonstrating an ill-defined perihilar infiltrative heterogeneous mass (white arrows) with associated intrahepatic biliary dilatation (red arrow). (D)arterial phase shows early marginal enhancement of the lesion.(E,F) portal and delayed phases show progressive enhancement of the lesion.
References: Department of diagnostic radiology, ALFA medical group, ALFA scan,Giza/EG")
Fig. 8:
Periductal infiltrative intrahepatic cholangiocarcinoma:(A)Precontrast axial...
 Axial T2WI demonstrating a mild hyperintense intraductal mass within the dilated right and left hepatic ducts (arrow). (B) Axial precontrast T1WI demonstrating a corresponding intraductal hypointense mass. (C) Delayed post-contrast MR image demonstrating delayed enhancement of the intraductal mass (arrow). References: Mittal P et al. (2015) Primary biliary tract malignancies. Abdominal imaging 40:1520-1557")
Fig. 9:
Intraductal cholangiocarcinoma: (A) Axial T2WI demonstrating a mild...

Fig. 10:
Diagram demonstrating enhancement pattern of fibrolamellar carcinoma with...
Axial T2WI shows that tumor (arrow) has heterogeneous high signal intensity. The central scar is hypointense on T2WI (arrowhead).(B) Arterial phase shows heterogeneous enhancement within the mass (arrow). No enhancement is seen within the central scar (arrowhead).(C) Delayed phase shows partial enhancement of the central scar (arrowhead).
References: Ganeshan D et al. (2014) Imaging Features of Fibrolamellar Hepatocellular Carcinoma. AJR 202: 544-552")
Fig. 11:
Fibrolamellar hepatocellular carcinoma.(A)Axial T2WI shows that tumor (arrow)...
 Primary biliary tract malignancies. Abdominal imaging 40:1520-1557")
Fig. 12:
FLC central scar calcification in CT

Fig. 13:
Diagram demonstrating enhancement pattern of metastasis.
T2WI shows multiple mild hyperintense lesions in the liver. (B) Arterial phase shows early band like enhancement of the lesions (red arrows). (c) Delayed phase shows progressive central enhancement with a hypointense rim “peripheral washout sign”(white arrows). References: Department of diagnostic radiology, ALFA medical group, ALFA scan, Giza/EG")
Fig. 14:
Metastatic liver tumors. (A)T2WI shows multiple mild hyperintense lesions in...
 Primary biliary tract malignancies. Abdominal imaging 40:1520-1557")
Fig. 15
 Arterial phase showing ring-like peripheral enhancement of the mass (arrow) but no enhancement of the central aspect of the lesion (hollow arrow).(B) Delayed phase demonstrating a progressive enhancement of the central aspect of the lesion (hollow arrow) with washout of its periphery(arrow). References: Mittal P et al. (2015) Primary biliary tract malignancies. Abdominal imaging 40:1520-1557")
Fig. 16:
Pathologically proven cholangiocellular carcinoma: (A) Arterial phase showing...
 Axial T2WI demonstrating a hyperintense lesion surrounding the right hepatic duct (arrow). (B) Precontrast axial T1WI demonstrating the corresponding low signal lesion (arrow). (C) Delayed phase demonstrating a progressive enhancing soft tissue mass (arrow). References: Mittal P et al. (2015) Primary biliary tract malignancies. Abdominal imaging 40:1520-1557")
Fig. 17:
Pathologically proven primary biliary lymphoma: (A) Axial T2WI demonstrating a...
Axial T2WI demonstrating a hyperintense lesion.(C)delayed phase demonstrating a progressive enhancing mass(arrows). References: Mittal P et al. (2015) Primary biliary tract malignancies. Abdominal imaging 40:1520-1557")
Fig. 18:
Pathologically proven lymphoepithelioma-like carcinoma:(A)Axial T2WI...

Fig. 19:
Diagram demonstrating enhancement pattern of hemangioma. Early phases show...
 heavy T2WI shows hyperintense lesion in segment II (arrow).(B,C) Arterial and portal phases show peripheral nodular enhancement of the lesion (arrows). (D) Delayed phase shows progressive complete fill-in (arrow). References: Department of diagnostic radiology, ALFA medical group, ALFA scan,Giza/EG")
Fig. 20:
Typical hepatic hemangioma. (A) heavy T2WI shows hyperintense lesion in segment...
 and metastatic lesions (C,D). References: Department of diagnostic radiology, ALFA medical group, ALFA scan, Giza/EG")
Fig. 21:
Main discriminatory features between hemangioma (A,B) and metastatic lesions...
 heavy T2WI shows hyperintense lesion in segment V and VI of the right hepatic lobe with bright central scar(asterisk).(B,C) Arterial and portal phases show peripheral nodular enhancement of the lesion. (D) Delayed phase shows progressive incomplete fill-in with non enhancing scar (asterisk). References: Department of diagnostic radiology, ALFA medical group, ALFA scan,Giza/EG")
Fig. 22:
Giant hepatic hemangioma.(A) heavy T2WI shows hyperintense lesion in segment V...

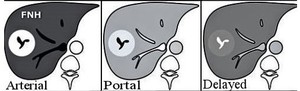
Fig. 23:
Diagram demonstrating enhancement pattern of focal nodular hyperplasia. Early...
 Axial SPAIR image shows a FNH lesion at segment VII (red arrows) that is hyperintense relative to the surrounding liver parenchyma. The central scar (white arrow) has slightly higher signal intensity than the lesion. (B,C)arterial and portal phases show intense homogeneous enhancement of the entire lesion, except for the central scar (arrow head). (D) delayed phase shows that the lesion has become isointense relative to the surrounding liver parenchyma, and the central scar (black arrow) has complete enhancement.
References: Department of diagnostic radiology, ALFA medical group, ALFA scan,Giza/EG")
Fig. 24:
Typical FNH. (A) Axial SPAIR image shows a FNH lesion at segment VII (red...

Fig. 25:
Characteristic features of giant hemangioma, FNH and FLC central scars

Fig. 26:
Diagram demonstrating enhancement pattern of confluent hepatic fibrosis. A...
 Axial SPAIR image shows a mild hyperintense wedge shaped subcapsular area at segment VIII/IVa (arrow) and associated capsular retraction (arrow head). (B)arterial phase shows non enhancement of the lesion (arrow).(C) delayed phase shows homogeneous enhancement of the lesion (arrow).
References: Department of diagnostic radiology, ALFA medical group, ALFA scan,Giza/EG")
Fig. 27:
Confluent hepatic fibrosis.(A) Axial SPAIR image shows a mild hyperintense...

Fig. 28:
Diagram showing delayed marginal enhancement in a treated HCC lesion...
 Axial T1WI shows a well defined lesion of high signal at segment V (white arrow). (B) axial T2WI shows a corresponding hypointense lesion. (C,D) arterial and subtraction arterial phases show non enhancement of the lesion i.e no evidence of tumoral viability. (D)delayed phase shows marginal enhancement of the lesion caused by perilesional granulation tissue (red arrow). References: Department of diagnostic radiology, ALFA medical group, ALFA scan, Giza/EG")
Fig. 29:
(A) Axial T1WI shows a well defined lesion of high signal at segment V (white...

Fig. 30:
Diagram demonstrating enhancement pattern of a pyogenic liver abscess. Arterial...
 Axial T2WI shows the double target sign of the abscess wall, seen as an iso- to hypointense inner layer (arrowhead) and a moderately hyperintense outer layer (arrow) surrounding the internal high-signal-intensity content of the abscess. Note the impacted hypointense stone in the gallbladder neck (*). (B) arterial phase shows early enhancement of the inner layer (arrowhead) and adjacent segmental hepatic parenchymal hyperemia (red arrow). (c) delayed phase shows delayed enhancement of the inner and outer layers (arrow).
References: Bächler P et al. (2016) Multimodality Imaging of Liver Infections. Radiographics 36:1001-1023")
Fig. 31:
Pyogenic liver abscess from acute gangrenous cholecystitis i. (a) Axial T2WI...
Axial T2WI demonstrating a hyperintense lesion involving segment IVA of left hepatic lobe (arrow).(B) Precontrast axial T1WI demonstrating the corresponding low signal lesion (arrow). (C) and (D) Arterial and delayed post-contrast axial images demonstrating a progressive enhancing soft tissue mass (arrow). References: Mittal P K et al. (2015) Primary biliary tract malignancies. Abdominal imaging 40:1520-57")
Fig. 32:
Inflammatory myofibroblastic tumor:(A)Axial T2WI demonstrating a hyperintense...
 shows progressive enhancement from arterial (A) to portal venous (B) and delayed (C) phases, with “branching” appearance. Because of progressive fill-in of contrast enhancement, findings were initially thought to be consistent with hemangioma. Percutaneous biopsy of lesion (not shown) was consistent with hepatocellular adenoma. However, histologic examination performed on resected surgical specimen showed peliosis hepatis.
Centripetal enhancement in peliotic lesions is rather uncommon finding; branching appearance of contrast enhancement in delayed phase is useful sign that may help in diagnosis. References: lannaccone R et al.(2006).Peliosis Hepatis: Spectrum of Imaging Findings. AJR 187: W43-W52")
Fig. 33:
Peliosis hepatis. A lesion (arrow) shows progressive enhancement from arterial...
axial T2WI shows that the T2 signal in the peripheral liver is higher with defined strands of elevated T2 signal, corresponding to fibrotic tissue. Arterial phase (B) images show nodular tissue corresponding to regenerative nodules. These show an elevated signal compared to intervening fibrotic tissue. This is due to higher protein content within hepatocytes, which causes an elevated T1 signal and increased vascularity, leading to greater enhancement on arterial and venous phase images. The delayed phase image (C) shows progressive uptake and enhancement of the fibrotic tissue. References: Chundru S et al (2013) MRI of diffuse liver disease: the common and uncommon etiologies. Diagnostic and interventional radiology 19:479–487")
Fig. 34:
Primary sclerosing cholangitis at severe stage. The peripheral liver shows...

Fig. 35:
Diagram summarizing hepatic focal lesions with different patterns of delayed...

Fig. 36