I. Imaging techniques in Takayasu’s arteritis
In 2018, guidelines for the use of imaging in large vessel vasculitis were issued by the European League Against Rheumatism (EULAR), precising imaging indications and multimodality protocols.
A. Imaging Indications
a. Diagnosis
Because clinical findings and biological test results are non-specific to TA, and because invasive arterial biopsy is not an option, imaging is recommended for diagnosis and evaluation of arterial involvement.
b. Follow-up
Imaging should not be obtained systematically as part of routine follow-up. Only clinical or biological suspicion of disease relapse or flare should warrant imaging in order to confirm it or not. Imaging can be however used for long-term monitoring of structural damage (stenosis, occlusion and aneurysms).
B. Available Imaging Techniques and Protocols
a. Conventional angiography
- The gold standard for several decades which has now been replaced by non-invasive imaging modalities.
b. Computed tomography (CT)
- Allows the analysis of both luminal and mural lesions of the arterial tree.
- Acquisition from supra-aortic trunks to iliac arteries.
- Post-contrast arterial phase, using a bolus-tracking method and ECG triggering, to evaluate vessel lumen.
- Post-contrast venous phase, performed 50 seconds after the end of the arterial phase, to assess mural enhancement.
c. Magnetic Resonance Imaging (MRI)
- Allows the analysis of both luminal and mural lesions of the arterial tree.
- 1.5 T or 3 T
- MR angiography of aorta from carotid bifurcation to iliac arteries to evaluate vessel lumen.
- Post-contrast T1-weighted (T1w) turbo spin echo sequence with black blood and fat suppression to assess mural enhancement.
- T2-weighted (T2w) turbo spin echo sequence for edema detection in mural inflammation.
- In patients with suspected TA, MRI should be favored over CT to avoid radiation exposure.
d. [18F]-fluoro-2-deoxy-D-glucose positron emission tomography (18F-FDG-PET)
- PET provides metabolical information.
- Hybrid technique associating PET and low-dose CT.
- Acquisition from top of head to below the knees.
e. Ultrasound with Doppler
- Another tool available to evaluate peripheral arteries in TA.
II. Diagnostic Assessment with Imaging
A. Common features encountered in Takayasu’s arteritis
The extent of TA can be classified according to arterial lesions distribution on angiography (Figure 2).

Fig. 2: Classification of Takayasu arteritis according to arterial lesions distribution on angiography (International TA Conference, Tokyo, 1994):
- Type I: branches of the aortic arch
- Type IIa: ascending aorta, aortic arch and its branches
- Type IIb: ascending aorta, aortic arch and its branches, and thoracic descending aorta
- Type III: thoracic descending aorta, abdominal aorta and/or renal arteries
- Type IV: abdominal aorta and/or renal arteries
- Type V: combined features of Type IIb and IV.
Involvement of the coronary and pulmonary arteries should be indicated as C (+) or P (+), respectively.
Types I and V have been documented as the most common types.
References: Hata A et al. Angiographic findings of Takayasu arteritis: new classification. Int J Cardiol 1996;54:S155–63.
a. Early-phase TA
- Concentric circumferential artery wall thickening (usually > 3 mm for the aorta) is the most common pathological feature in early-phase TA (Figure 3). Long and irregular arterial wall thickening is evocative of large vessel vasculitis, although not specific. Typically, the mural thickening shows high attenuation on non-enhanced CT. It can also be identified on MRI with T1w and T2w images.

Fig. 3: Post-contrast CT, axial views. (a) Aneurysm of the ascending aorta associated with a concentric circumferential wall thickening of the ascending and descending aorta. (b) Concentric circumferential wall thickening of the supra-aortic trunks at their origin. (c) Concentric circumferential wall thickening of the right internal carotid artery (c).
- Late contrast enhancement of the arterial wall, seen on venous phase of post-contrast CT or T1w images (Figure 4), suggests arterial wall inflammation.
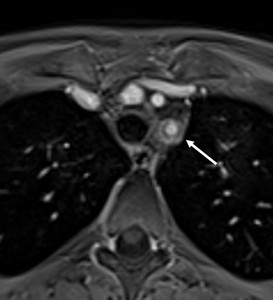
Fig. 4: Post-contrast T1-weighted MRI, axial view. Typical “double ring” sign (arrow) of the wall of the left subclavian artery after gadolinium administration, with intense peripheral enhancement of outer arterial wall and relative hypo-enhancement of inner arterial wall.
- Arterial wall edema, resulting in high signal intensity on T2w images (Figures 5 and 6), also suggests inflammatory process.

Fig. 5: T2w TSE MRI, axial views. (a) Circumferential wall thickening of the descending aorta (arrow). (b) Circumferential wall thickening of the left subclavian artery (arrow). In both cases, the thickened arterial wall shows with high signal intensity, likely associated with edema, suggesting arterial wall inflammation.

Fig. 6: FLAIR, axial view (a). Circumferential wall thickening of the right internal carotid artery with high signal intensity, likely associated with edema, suggesting arterial wall inflammation.
Time-of-flight, axial view (b). Corresponding stenosis of the right internal carotid artery.
- 18F-FDG uptake by inflammatory cells allows to visualize arterial wall inflammation (Figure 7). Images provide qualitative data based on visual comparison of arterial wall uptake and constitutive uptake in normal tissue (liver); or semi-quantitative data, based on a standardized uptake value (SUV).

Fig. 7: Post-contrast CT, axial view (a). Concentric circumferential wall thickening of the ascending and descending aorta (arrows).
18F-FDG-PET-CT, axial views (b and c). Corresponding increased FDG uptake of the wall of the ascending and descending aorta, at least as important as the liver uptake.
b. Advanced TA
- Stenosis, and eventually occlusion, secondary to persistent arterial wall thickening, is the most common finding in more advanced stages. Stenotic lesions are usually found near the origin of the aortic branches (Figure 8), most frequently in the subclavian arteries, common carotid arteries and renal arteries (Figure 9).

Fig. 8: Post-contrast MRA (a) and post-contrast CT (b), coronal views, MIP reconstructions. Stenosis of the origin of the left renal artery (arrows).

Fig. 9: Post-contrast CT, coronal view (a and b). Significant stenosis of the brachiocephalic artery, before (a) and after (b) surgical treatment with bypass.
- Extensive vascular calcifications, typically involving the ascending aorta with a circumferential pattern, can be observed (Figure 10).

Fig. 10: Post-contrast CT, sagittal MIP reconstructions (a) and axial views (b and c). Localized circumferential calcifications and wall thickening of the descending aorta. The localisation and circumferential pattern of calcifications are evocative of vasculitis rather than atherosclerosis.
- Aneurysms, typically fusiform, are less common and preferentially seen in the ascending and abdominal aorta.
B. Differentials: atherosclerosis and giant cell arteritis
a. Atherosclerosis is usually observed in patients > 45 years. Arterial plaques are typically identified as focal and eccentric arterial wall thickening, associated or not with stenosis.
b. Giant cell arteritis (GCA) mainly affects patients > 50 years and involves branches of the external and internal carotid arteries. Aortic aneurysms are more common in GCA, while stenotic changes of the aorta are more typical of TA.
III. Disease Activity Assessment with Imaging
A. Active versus non-active disease
Different scores to quantify disease activity based on clinical findings and laboratory tests have been proposed. Only the American National Institute of Health (NIH) score takes into consideration imaging features found on angiography.
Discrepancies between clinical findings, biological parameters and imaging features are frequently observed during the course of TA evolution, making an evaluation on these sole features difficult.
B. Imaging markers of disease activity
Functional imaging may nonetheless play a role in assessing disease activity. Several markers have been identified to serve this purpose.
- Arterial wall enhancement can be an indicator of active disease, suggesting hyperaemia in an inflamed artery. Arterial wall enhancement is measured in comparison to peripheral muscle enhancement on CT and MRI. Although arterial wall enhancement is admitted as a marker of activity, some studies have not identified significant enhancement differences between active and non-active patients.
- Arterial wall edema, resulting in high signal intensity on T2w MRI also suggests active inflammatory process. Again, contradictory results exist in the literature and some authors describe no association between edema on MRI and disease activity. Additionally, recent guidelines reported T2w imaging to present a low sensitivity for edema detection, these sequences being prone to artefacts.
- 18F-FDG uptake can also evaluate disease activity in the arterial wall, although some clinically and biologically inactive patients have been reported to show high 18F-FDG uptake.
The reported presence of arterial wall enhancement, edema, and 18F-FDG uptake in patients with clinical and biological non-active TA (Figures 11 and 12) raises concern for the accuracy of these markers to evaluate disease activity. Persistent arterial wall enhancement and 18F-FDG uptake may be linked to the fibrotic evolution of arterial lesions.

Fig. 11: Post-contrast CT, coronal view, MIP reconstruction (a). Stenosis of the origin of the common carotids arteries (arrows), with the characteristic ‘‘rat tail’-like configuration.
Non-contrast (b) and post-contrast (c) T1w MRI, coronal views. Wall thickening of the left common carotid artery (arrow), with post-contrast enhancement (arrow). Interestingly, this 24 year-old female was free of symptoms and biological markers of inflammation were negative.

Fig. 12: Post-contrast T1w MRI, axial view (a). Concentric circumferential wall thickening and contrast enhancement of the abdominal aorta and the origin of the superior mesenteric artery (arrows).
Post-contrast MRA, sagittal view (b). Corresponding long and irregular stenosis of the superior mesenteric artery (arrowheads).
This 34 year old female otherwise demonstrated normal physical examination and normal laboratory tests.
C. Future markers?
There is a need for novel markers to identify arterial wall inflammation and monitor TA under treatment. New inflammation-targeted MRI contrast agents (elastin-specific, collagen-specific, or macrophage-targeted agents) and intravascular contrast agents identifying the presence of increased vessel density in the arterial wall (gadofosvet trisodium) may help to differentiate fibrosis from active inflammation. Direct quantitative imaging such as T1 and T2 mapping may also have a role to play in assessing disease activity.

:
- Type I: branches of the aortic arch
- Type IIa: ascending aorta, aortic arch and its branches
- Type IIb: ascending aorta, aortic arch and its branches, and thoracic descending aorta
- Type III: thoracic descending aorta, abdominal aorta and/or renal arteries
- Type IV: abdominal aorta and/or renal arteries
- Type V: combined features of Type IIb and IV.
Involvement of the coronary and pulmonary arteries should be indicated as C (+) or P (+), respectively.
Types I and V have been documented as the most common types.
References: Hata A et al. Angiographic findings of Takayasu arteritis: new classification. Int J Cardiol 1996;54:S155–63.")
 Aneurysm of the ascending aorta associated with a concentric circumferential wall thickening of the ascending and descending aorta. (b) Concentric circumferential wall thickening of the supra-aortic trunks at their origin. (c) Concentric circumferential wall thickening of the right internal carotid artery (c).")
 of the wall of the left subclavian artery after gadolinium administration, with intense peripheral enhancement of outer arterial wall and relative hypo-enhancement of inner arterial wall.")
 Circumferential wall thickening of the descending aorta (arrow). (b) Circumferential wall thickening of the left subclavian artery (arrow). In both cases, the thickened arterial wall shows with high signal intensity, likely associated with edema, suggesting arterial wall inflammation.")
. Circumferential wall thickening of the right internal carotid artery with high signal intensity, likely associated with edema, suggesting arterial wall inflammation.
Time-of-flight, axial view (b). Corresponding stenosis of the right internal carotid artery.")
. Concentric circumferential wall thickening of the ascending and descending aorta (arrows).
18F-FDG-PET-CT, axial views (b and c). Corresponding increased FDG uptake of the wall of the ascending and descending aorta, at least as important as the liver uptake.")
 and post-contrast CT (b), coronal views, MIP reconstructions. Stenosis of the origin of the left renal artery (arrows).")
. Significant stenosis of the brachiocephalic artery, before (a) and after (b) surgical treatment with bypass.")
 and axial views (b and c). Localized circumferential calcifications and wall thickening of the descending aorta. The localisation and circumferential pattern of calcifications are evocative of vasculitis rather than atherosclerosis.")
. Stenosis of the origin of the common carotids arteries (arrows), with the characteristic ‘‘rat tail’-like configuration.
Non-contrast (b) and post-contrast (c) T1w MRI, coronal views. Wall thickening of the left common carotid artery (arrow), with post-contrast enhancement (arrow). Interestingly, this 24 year-old female was free of symptoms and biological markers of inflammation were negative.")
. Concentric circumferential wall thickening and contrast enhancement of the abdominal aorta and the origin of the superior mesenteric artery (arrows).
Post-contrast MRA, sagittal view (b). Corresponding long and irregular stenosis of the superior mesenteric artery (arrowheads).
This 34 year old female otherwise demonstrated normal physical examination and normal laboratory tests.")