ECR 2020 / C-14517
Pre-stablished delays in Hepatic CT studies: is there space to optimization?
Congress:
ECR 2020
Poster Number:
C-14517
Type:
Scientific Exhibit
Keywords:
Performed at one institution, Observational, Prospective, Haemodynamics / Flow dynamics, Drugs / Reactions, Diagnostic procedure, Contrast agent-intravenous, CT, Radiographers, Liver, Contrast agents
Authors:
A. D. Gomes1, M. C. Couto1, R. M. S. C. Pereira1, R. M. Cardoso1, N. M. M. Neves1, R. C. M. C. R. Gaspar2, M. Santos1; 1Aveiro/PT, 2Coimbra/PT
DOI:
10.26044/ecr2020/C-14517
 - Aveiro/PT")
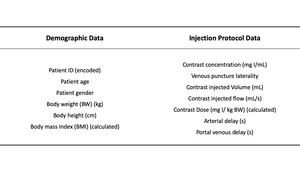
Table 1:
Resume of collected data
 - Aveiro/PT")
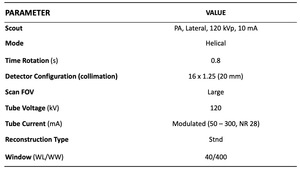
Table 2:
Resume of the technical protocol
 - Aveiro/PT")
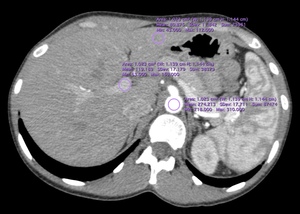
Fig. 1:
Example of the ROI's arrangement to perform structures HU measurement.