ECR 2020 / C-14517
Pre-stablished delays in Hepatic CT studies: is there space to optimization?
Congress:
ECR 2020
Poster Number:
C-14517
Type:
Scientific Exhibit
Keywords:
Performed at one institution, Observational, Prospective, Haemodynamics / Flow dynamics, Drugs / Reactions, Diagnostic procedure, Contrast agent-intravenous, CT, Radiographers, Liver, Contrast agents
Authors:
A. D. Gomes1, M. C. Couto1, R. M. S. C. Pereira1, R. M. Cardoso1, N. M. M. Neves1, R. C. M. C. R. Gaspar2, M. Santos1; 1Aveiro/PT, 2Coimbra/PT
DOI:
10.26044/ecr2020/C-14517
 - Aveiro/PT")
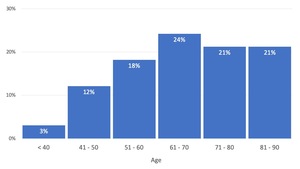
Fig. 2:
Box plot of the Sample distribution according to patient's age.
 with calculated linear regressions. References: School of Health Sciences, University of Aveiro (ESSUA) - Aveiro/PT")
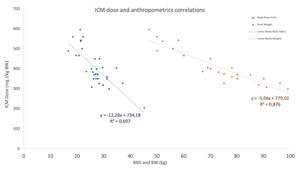
Fig. 3:
Scatter plot of correlation between ICM contrast dose and patient body...
 and portal venous (orange) delays. References: School of Health Sciences, University of Aveiro (ESSUA) - Aveiro/PT")
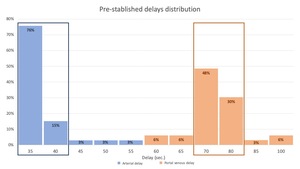
Fig. 4:
Box plot of the sample distribution according to used pre-stablished arterial...
 - Aveiro/PT")
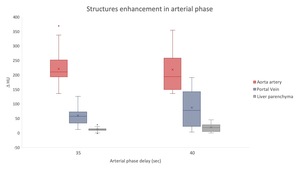
Fig. 5:
Box and whisker plot of structures enhancement in arterial phase
 - Aveiro/PT")
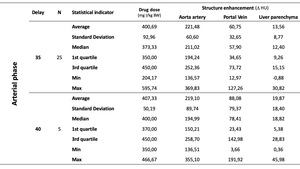
Table 3:
Descriptive statistics of the arterial phase enhancement
 - Aveiro/PT")
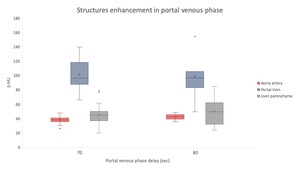
Fig. 6:
Box and whisker plot of structures enhancement in portal venous phase
 - Aveiro/PT")
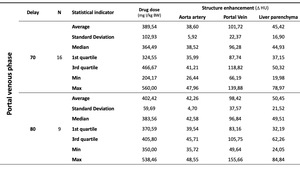
Table 4:
Descriptive statistics of the portal venous phase enhancement