Keywords:
Multicentre study, Observational, Prospective, Haemodynamics / Flow dynamics, Drugs / Reactions, Diagnostic procedure, Contrast agent-intravenous, CT, Radiographers, Liver, Contrast agents
Authors:
R. M. S. C. Pereira1, A. D. Gomes1, M. C. Couto1, M. A. SANTOS2, R. C. M. C. R. Gaspar3, R. M. Cardoso1, N. M. F. Campos3, N. M. M. Neves1, M. Santos1; 1Aveiro/PT, 2ARAZEDE/PT, 3Coimbra/PT
DOI:
10.26044/ecr2020/C-14682
Methods and materials
1. Data collection
After appropriate authorization, a six-week prospective study, conducted in two different hospitals in the centre region of Portugal, collected information on multiphase hepatic CT examinations of adult patients. Hospital_A used pre-established delays and Hospital_B used bolus-tracking support systems to optimize arterial and portal delays. The patients’ confidentiality, as well as of all actors involved in health care, was ensured.
A questionnaire was used to collect pertinent intravenous contrast injection protocol data and anthropometric measurements (body weight and body height) along with the query & retrieve of relevant DICOM metadata for posterior analysis. Table 1 resumed collected data.
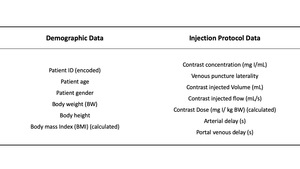
Table 1: Resume table of the collected data
References: School of Health Sciences, University of Aveiro (ESSUA) - Aveiro/PT
2. Structures enhancement quantitative analysis
Contrast enhancement was evaluated in CT images for three structures – Aorta artery, portal vein and liver parenchyma. The Hounsfield Units (HU) measurements were performed to non-enhanced and contrast-enhanced phases in axial images at the level of the emergence of the celiac trunk artery using circular ROI’s of 100 mm2 as presented in Fig. 1. Aorta artery ROI was placed in the centre of the aorta, portal vein ROI was placed in the hepatic hilar zone (main portal vein) and liver parenchyma ROI was placed on segment III with no significant vascular or biliary structures contribution.
Hounsfield Units average of each measurement was collected, and structures enhancement calculated to each contrast-enhanced phase by the difference between enhanced and non-enhanced structures HU average values.
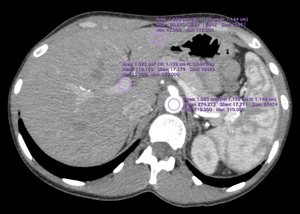
Fig. 1: Example of the ROI's arrangement to perform structures HU measurement.
References: School of Health Sciences, University of Aveiro (ESSUA) - Aveiro/PT
3. Statistical analysis
Collected data were evaluated using IBM© SPSS© Statistics 25. Scale variables were summarized as the average value ± standard deviation (SD) and categorical variables were calculated as the count (percentage). Collected data were processed with parametric tests, and analysis of variance and mean differences t-test were performed.
Statistical significance was considered when p<0.05.

 - Aveiro/PT")
 - Aveiro/PT")