ECR 2020 / C-14682
The impact of injection protocol in liver CT studies: a comparative analysis between two health facilities
Congress:
ECR 2020
Poster Number:
C-14682
Type:
Scientific Exhibit
Keywords:
Multicentre study, Observational, Prospective, Haemodynamics / Flow dynamics, Drugs / Reactions, Diagnostic procedure, Contrast agent-intravenous, CT, Radiographers, Liver, Contrast agents
Authors:
R. M. S. C. Pereira1, A. D. Gomes1, M. C. Couto1, M. A. SANTOS2, R. C. M. C. R. Gaspar3, R. M. Cardoso1, N. M. F. Campos3, N. M. M. Neves1, M. Santos1; 1Aveiro/PT, 2ARAZEDE/PT, 3Coimbra/PT
DOI:
10.26044/ecr2020/C-14682
 - Aveiro/PT")
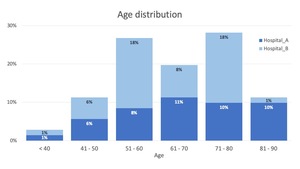
Fig. 2:
Box plot of the sample distribution according to patient's age and institution.
 - Aveiro/PT")
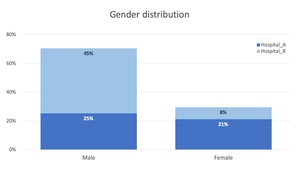
Fig. 3:
Box plot of the Sample distribution according to patients's gender
 - statistically significant differences between 3 mL/s and other flow rates] References: School of Health Sciences, University of Aveiro (ESSUA) - Aveiro/PT")
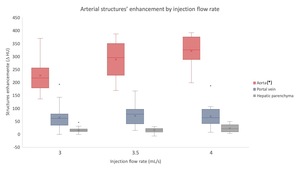
Fig. 4:
Box and whisker plot of structures arterial enhancement according to used...
 - statistically significant differences between 3 mL/s and other flow rates] References: School of Health Sciences, University of Aveiro (ESSUA) - Aveiro/PT")
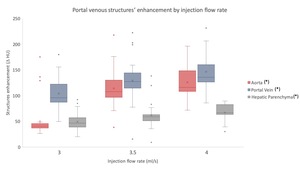
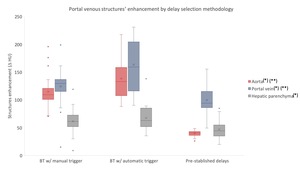
Fig. 5:
Box and whisker plot of structures portal venous enhancement according to used...
 - statistically significant differences between pre-stablished delays and bolus tracking methods] References: School of Health Sciences, University of Aveiro (ESSUA) - Aveiro/PT")
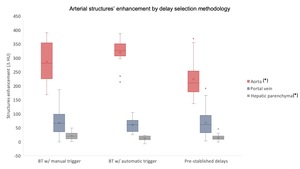
Fig. 6:
Box and whisker plot of structures arterial enhancement according to delay...
 - statistically significant differences between pre-stablished delays and Bolus tracking methods; (**) - statistically significant differences between each 3 delay selection methodologies] References: School of Health Sciences, University of Aveiro (ESSUA) - Aveiro/PT")
Fig. 7:
Box and whisker plot of structures arterial enhancement according to delay...
 - Aveiro/PT")
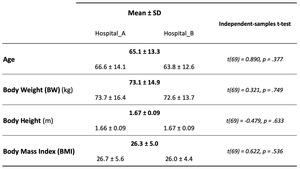
Table 2:
Resume table of the patients indicators comparative analysis between...
 - Aveiro/PT")
Table 3:
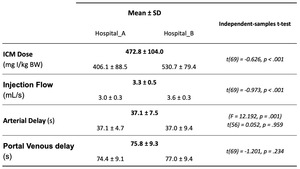
Resume table of the ICM injection protocol data with comparative analysis...
 - Aveiro/PT")
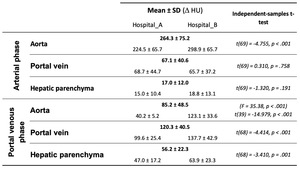
Table 4:
Resume table of the structures enhamencement in arterial and portal venous...
 - Aveiro/PT")
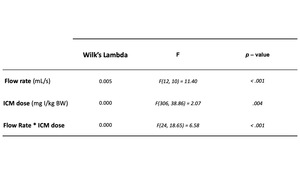
Table 5:
Resume table of the multivariate analysis of variance of structures...