The CS masses are usually first assessed using ultrasound and CECT, but MRI comes more often as an indispensable examination for a precise description of the CS lesions regarding their tissue origin and anatomical relationship with the surrounding structures.
The imaging diagnostic approach to CS masses implies the following questions (Table 3 ) [1,2,4,5]:
- Does the mass arise primarily from the CS? CS mass displacement pattern is equal to a compass for one to orient itself and depends on the level of the lesion (Table 4 ) [1, 2, 4]
- What are the normal contents of the CS at the level of the lesion?
- What pathology arises from these contents, how to recognize a specific radiological pattern and does this correspond to the patient’s symptoms? [5]
- Which are the most common tumors found in the CS?
- Considerations when the image shows a SHN CS mass?
- What imaging pitfalls may be encountered?
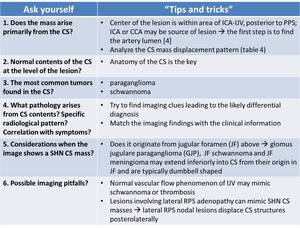
Table 3: “ Tips and tricks” for the diagnostic approach of CS masses. ICA – internal carotid artery; IJV – internal jugular vein; PPS – parapharyngeal space; CCA – common carotid artery; RPS – retropahryngeal space.
References: adapted from [1,2,4,5]
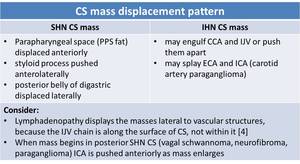
Table 4: Carotid space mass displacement pattern depending on the level of the lesion. CCA – common carotid artery; IJV – internal jugular vein; ECA – external carotid artery; ICA – internal carotid artery.
References: adapted from [1, 2, 4]
MRI imaging findings and helpful clues in CS masses
1. Glomus bodies lesions (Paragangliomas) [2, 3, 4]:
- benign vascular tumors arising in paraganglia (clusters of neuroendocrine cells);
- highly vascular nature: biopsy carries significant risk;
- types of CS paragangliomas (Table 5): carotid body paraganglioma (CBP, Fig. 10, Fig. 13), glomus vagale paraganglioma (GVP), glomus jugulare paraganglioma (GJP, Fig. 11, Fig. 12);
-
T1WI: signal similar to muscle, “salt and pepper” if >1,5 cm: a combination of punctate regions of hemorrhage/slow flow (“salt”) and flow voids due to high vascularity (“pepper”);
T2WI: signal slightly above that of muscle, “salt and pepper” appearance;
T1 C+: intense enhancement with rapid wash-in and wash-out; flow voids;
- paraganglioma has been reported in association with thyroid carcinoma, visceral neoplasms, familial MEN syndrome.
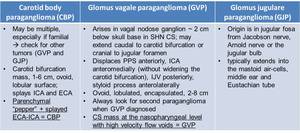
Table 5: Types of carotid space paragangliomas with key specific characteristics. ICA – internal carotid artery; ECA – external carotid artery, PPS- parapharyngeal space; IJV – internal jugular vein.
References: adapted from [2, 3].
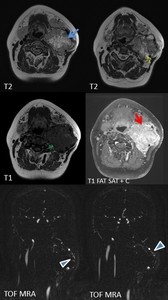
Fig. 10: Female patient, 45 y, left laterocervical palpable mass. MRI shows left carotid bifurcation mass (blue arrow) that splays ICA and ECA, with inhomogenous structure presenting liquid degeneration (yellow arrow) and “flow voids” (green arrow) that have a high signal on TOF MRA (arrowheads) indicating intralesional arterial flow. On T1+C - intense inhomogenouos enhancement is present (red arrow). MRI appeareance of carotid body paraganglioma
References: Emergency County Hospital Cluj – Napoca, Romania
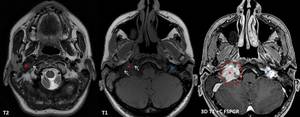
Fig. 11: Female patient, 45 y, post radiotherapy for bilateral GJP. Control MRI demonstrates irregular mass located at the left jugular foramen (red *), hypointense with flow voids on T1 and T2 (arrows), with vivid contrast enhancement (red circle), invading the neighboring structures (fig. 12). A smaller mass with similar features can be seen at the level of left jugular foramen, with no invasion signs (blue *).
References: Emergency County Hospital Cluj – Napoca, Romania
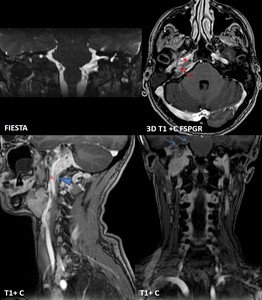
Fig. 12: Same patient as in fig. 11. The mass is extended inferiorly to carotid bifurcation, in contact with internal carotid artery (A) along ~ 6 cm distance, superiorly invades the petrous part of temporal bone (red arrow) and temporal meninges (blue arrows), embeds the petrous internal carotid artery (red *), laterally extends into internal acoustic meatus and middle ear (white *). Right internal jugular vein is embedded in GJP, not seen on native sequences, with narrowed caliber post contrast (arrowhead).
References: Emergency County Hospital Cluj – Napoca, Romania
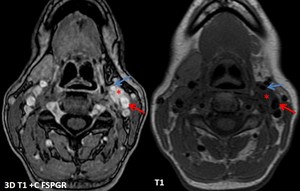
Fig. 13: Same patient as in fig 11. A synchronous left CBP is revealed (*), splaying the left external (blue arrow) and internal (red arrow) carotid arteries. Notice that on this smaller CBP (~ 1/1/2 cm) it is hard to distinguish the specific “salt and pepper” sign. On T1+C intense inhomogenouos enhancement is present.
References: Emergency County Hospital Cluj – Napoca, Romania
2. Nerve sheath tumors (CN 9-11) [2, 3, 4]:
Peripheral nerve sheath tumors are categorized as schwannoma = benign tumor of Schwann cells or neurofibroma (NF) = made up of proliferation of benign spindle cells (associated with NF1, potential for malignant transformation) (Table 6, Fig. 14). Both have similar imaging findings, but can be differentiated by their configuration relative to the affected nerve, as the schwannoma usually has an eccentric position relative to the parent nerve [3].
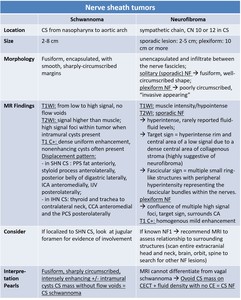
Table 6: Imaging findings for carotid space nerve sheath tumors. PPS – parapharyngeal space; ICA – internal carotid artery; IJV – internal jugular vein; CCA – common carotid artery; PCS – posterior cervical space; CN – cranial nerves; NF – neurofibroma; NF1 – neurofibromatosis type 1.
References: adapted from [2, 3, 15].
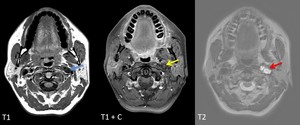
Fig. 14: Schwannoma of CN X and XI - female patient, 46 y, incidental finding on a cerebral MRI.
Centered lesion (blue arrow) between left ICA (situated on anteromedial margin) and IJV, with mainly liquid signal indicating a cystic change and “salami like”/fascicular sign appearance (red arrow), with sharp margins and absence of high velocity flow voids; with partial enhancement in the anterior part at aprox. 10 min after contrast administration (yellow arrow).
References: Emergency County Hospital Cluj – Napoca, Romania
3. CS Meningioma (CSM):
Meningioma of SHN CS arising from jugular foramen.
Imaging features are described in Table 7.
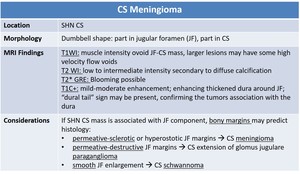
Table 7: Imaging findings for carotid space meningioma.
References: adapted from [2, 3].
4. Deep cervical lymph nodes chain pathology
The imaging modality of choice, in this case, is sonography and CECT, but lately, MRI can lead to better discrimination of benign vs malignant LNs.
Steps for analyzing the LNs:
a) Identify the LNs (differential diagnosis with other pathologies that may mimic a lymph node: congenital cystic lesions, infectious or inflammatory processes, normal structures mimicking LNs, primary neoplastic processes);
b) Determine if the LNs are benign or malignant:
- morphologic criteria on conventional MRI [6] (Table 8);
- combined diffusion-weighted MRI (DWI-MRI) and dynamic contrast-enhanced MRI (DCE-MRI);
c) Think of the LNs pathology: inflammation (reactive), infection (suppurative) or tumor (SCCa, Fig. 15).
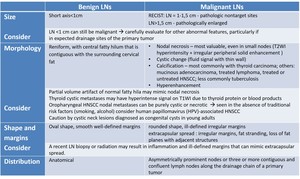
Table 8: Comparison of morphological criteria for benign vs malignant cervical lymph nodes (LNs). Recist - Response Evaluation Criteria In Solid Tumors; HNSCC – head and neck squamous cell carcinoma.
References: adapted from [6].
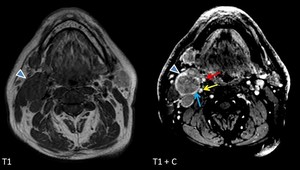
Fig. 15: Male patient, 45 y, diagnosed with non-keratinizing squamous cell carcinoma of the nasopharynx with extension in the left palatine tonsil (T4bN2bMx). Multiple IIA level adenopathies (arrowhead) with features highly suggestive for metastatic nature, with anteromedial displacement of ECA (red arrow) and posteromedial displacement of ICA (yellow arrow), compression of IJV (blue arrow), as well as right sternocleidomastoid muscle invasion.
References: Emergency County Hospital Cluj – Napoca, Romania
DWI-MRI:
From the up-to-date studies results that apparent diffusion coefficient (ADC) values are [7, 8, 9]:
- Higher in benign LNs (Fig. 16) > malignant LNs (Fig. 17) > lymphomatous LNs (Fig. 18);
- Higher in moderately differentiated metastatic LNs > poorly differentiated metastatic LNs.
Problems of overlap [10]:
- areas of micronecrosis (smaller than the voxel size on MR) may alter the ADC value;
- a dense fibrous reaction in inflammatory LNs may restrict the diffusion of water protons.
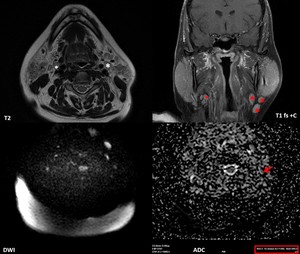
Fig. 16: 42-year-old woman known with Sjogren syndrome since 2017, suspected for NHL in 2018, the biopsy revealed marginal-zone lymphoma of the parotid glands. MRI shows multiple laterocervical adenopathies, including in the IJV chain (white *) as enhancing ovoid lesions (red *) with low T1, high T2 signal, no necrosis. Mildly high signal intensity consistent with diffusion restriction was present on DWI images (b=1000 s/mm2). The ADC value of lymphadenopathy was measured (red arrow) as 1,4×10⁻³ mm2/s, which in combination with morphological features proves the benign/reactive nature of the lymph nodes.
References: Emergency County Hospital Cluj – Napoca, Romania
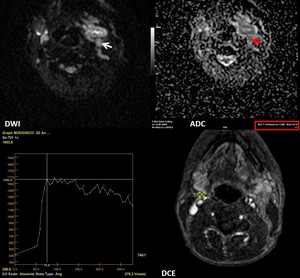
Fig. 17: 56-year-old man with low differentiated squamous cell carcinoma of the tongue (cT4aN3bM0) with multiple metastatic adenopathies. DWI (b=1000 s/mm2) showed a signal increase consistent with diffusion restriction (white arrow). The ADC value was measured (red arrow) as 1,3x10⁻³ mm2/s. DCE MRI scan shows the ROI (yellow outline) in the lymph node during the DCE sequence. The time-signal intensity curve (TIC) profile corresponds to type 3 (rapid uptake with low wash-out ratio) for these metastatic lymph nodes.
References: Emergency County Hospital Cluj – Napoca, Romania
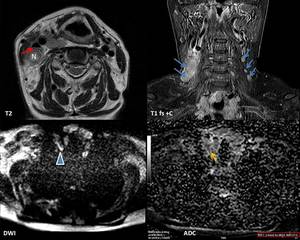
Fig. 18: Female patient, 63 y, lymphocyte-rich classical Hodgkin's lymphoma (LRCHL) stage I E B, developed on Hashimoto thyroiditis. MRI shows bilateral cervical lymph nodes (LNs) from IIb level superiorly to supraclavicular level inferiorly, mildly hyperintense on T2WI, with diffuse contrast enhancement (blue arrows), some with focal necrosis (N). The LNs compress the right internal jugular vein (red arrow), but the fat plane delineation is present. DWI (b=1000 s/mm2) showed a signal increase consistent with diffusion restriction (arrowhead). The ADC value was measured (yellow arrow) as 0,6x10⁻³ mm2/s .
References: Emergency County Hospital Cluj – Napoca, Romania
DCE-MRI:
Five types of time signal intensity curve (TIC) profiles have been described [11]:
- Type 1: enhancement ratio (ER) ≤ 20%;
- Type 2: slow uptake, ER>20%, maximum time (MT) ≥ 120s (Fig. 19, Fig. 20);
- Type 3: rapid uptake with low wash-out ratio (WR), ER>20%, MT<120 s ( Fig. 17, Fig. 21);
- Type 4: rapid uptake with high WR, ER>20%, MT<120 s;
- Type 5: not part of any of the above.
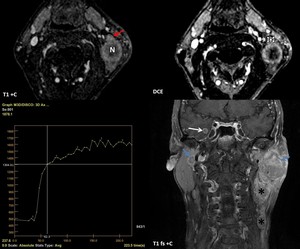
Fig. 19: 57-year-old man with adenocarcinoma of the lung. MRI shows bilateral parotid metastatic nodes (blue arrows), level II and III adenopathic blocks with cariokinetic features (*) and cerebral metastasis (white arrow). DCE MRI scan shows the ROI (white outline) in the lymph node during the DCE sequence. Notice that the ROI should be placed in the area of the LN that is not necrotic (red arrow). The time-signal intensity curve (TIC) profile corresponds to type 2 (slow uptake) for these metastatic LN. N = focal necrosis.
References: Emergency County Hospital Cluj – Napoca, Romania
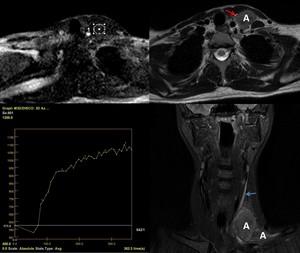
Fig. 20: Female patient, 24 y, with lymphoma. Several inhomogeneous adenopathies can be noticed at the level of left supraclavicular region (A), displacing the internal jugular vein (IJV) anteriorly (red arrow) and causing a slow flow (blue arrow) in the IJV due to compression. The time-signal intensity curve (TIC) profile corresponds to type 2 = slow uptake. White outline – the ROI placed on the DCE-MRI scan.
References: Emergency County Hospital Cluj – Napoca, Romania
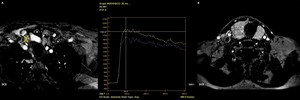
Fig. 21: DCE MRI scan of the same patient as in fig 18. The image in A shows the ROI (yellow outline) in the node during the DCE sequence, the image on B shows the ROI (white outline) in the thyroid gland. The time-signal intensity curve (TIC) profile corresponds to type 3 (rapid uptake with low wash-out ratio) for the node (blue curve 1), as well as for the thyroid parenchymal changes (yellow curve 2).
References: Emergency County Hospital Cluj – Napoca, Romania
A combination of DWI-MRI + DCE-MRI can better differentiate between benign and malignant tumors, as well as between different histological types.
5. Congenital remnants of CS
a) Ectopic (cervical) thymus [2, 12, 13]
Rare congenital lesion of incomplete descent of thymus into the chest, usually found in the cervicothoracic junction (Table 9, Fig. 22), but may occur anywhere along the path of descent through the thymopharyngeal duct.
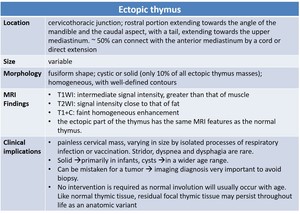
Table 9: Imaging findings for ectopic (cervical) thymus.
References: adapted from [2, 12].
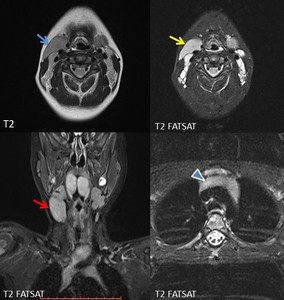
Fig. 22: Male patient, 6y, palpable mass in the right neck. On MRI bilateral neck mass, larger on the right side (red arrow), anterior to the carotid/jugular vessels (blue arrow), extending from the upper to the middle neck region. The tissue signal is similar to the mediastinal thymus (arrowhead).
References: Case courtesy: Otilia Fufezan MD, Pediatric Emergency Hospital Cluj – Napoca, Romania
b) 2nd branchial cleft cyst (2nd BCC) variant [2, 14]
A cystic remnant from the failure of obliteration of cervical sinus (leads to 2nd BCC, sinus or fistula or any combination of these three); most common (90-95%) of all branchiogenic malformations. Imaging findings are summarized in Table 10, an example of 2nd BCC in Fig. 23.
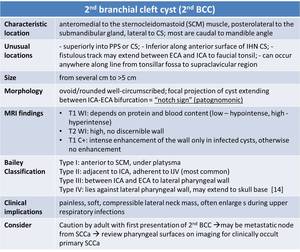
Table 10: Imaging findings for 2nd branchial cleft cyst. PPS – parapharyngeal space; ECA – external carotid artery; ICA – internal carotid artery; SCCa – squamous cell carcinoma.
References: adapted from [2, 14].
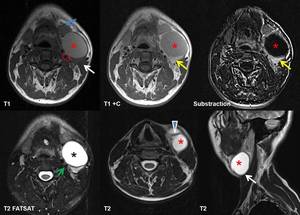
Fig. 23: 32-year-old man with compressible left lateral neck mass. MRI shows a well-defined, ovoid cystic lesion (red *) with one septum (arrowhead), situated posterolaterally to submandibular gland (blue arrow), laterally to carotid space (red outline) and anteromedially to sternocleidomastoid muscle (white arrows). The cyst is hyperintense on T2WI (black *), slightly hyperintense on T1WI due to proteinaceous content, with a peripheral wall enhancement on T1+C and substraction images (yellow arrows) (suggesting possible recurrent infection); no intracystic enhancement was found. The anatomical relationship is typical for a 2nd branchial cleft cyst type II after Bailey classification (adjacent to ICA – green arrow), which was also demonstrated on the histology exam after surgical cyst removal.
References: Case courtesy: Assoc.Prof.Dr Horatiu Rotaru, Oral and Cranio-Maxillofacial Department, UMF Iuliu Hatieganu Cluj Napoca


 that splays ICA and ECA, with inhomogenous structure presenting liquid degeneration (yellow arrow) and “flow voids” (green arrow) that have a high signal on TOF MRA (arrowheads) indicating intralesional arterial flow. On T1+C - intense inhomogenouos enhancement is present (red arrow). MRI appeareance of carotid body paraganglioma
References: Emergency County Hospital Cluj – Napoca, Romania")
, hypointense with flow voids on T1 and T2 (arrows), with vivid contrast enhancement (red circle), invading the neighboring structures (fig. 12). A smaller mass with similar features can be seen at the level of left jugular foramen, with no invasion signs (blue *).
References: Emergency County Hospital Cluj – Napoca, Romania")
 along ~ 6 cm distance, superiorly invades the petrous part of temporal bone (red arrow) and temporal meninges (blue arrows), embeds the petrous internal carotid artery (red *), laterally extends into internal acoustic meatus and middle ear (white *). Right internal jugular vein is embedded in GJP, not seen on native sequences, with narrowed caliber post contrast (arrowhead).
References: Emergency County Hospital Cluj – Napoca, Romania")
, splaying the left external (blue arrow) and internal (red arrow) carotid arteries. Notice that on this smaller CBP (~ 1/1/2 cm) it is hard to distinguish the specific “salt and pepper” sign. On T1+C intense inhomogenouos enhancement is present.
References: Emergency County Hospital Cluj – Napoca, Romania")

 between left ICA (situated on anteromedial margin) and IJV, with mainly liquid signal indicating a cystic change and “salami like”/fascicular sign appearance (red arrow), with sharp margins and absence of high velocity flow voids; with partial enhancement in the anterior part at aprox. 10 min after contrast administration (yellow arrow). References: Emergency County Hospital Cluj – Napoca, Romania")

. Recist - Response Evaluation Criteria In Solid Tumors; HNSCC – head and neck squamous cell carcinoma.
References: adapted from [6].")
. Multiple IIA level adenopathies (arrowhead) with features highly suggestive for metastatic nature, with anteromedial displacement of ECA (red arrow) and posteromedial displacement of ICA (yellow arrow), compression of IJV (blue arrow), as well as right sternocleidomastoid muscle invasion.
References: Emergency County Hospital Cluj – Napoca, Romania")
 as enhancing ovoid lesions (red *) with low T1, high T2 signal, no necrosis. Mildly high signal intensity consistent with diffusion restriction was present on DWI images (b=1000 s/mm2). The ADC value of lymphadenopathy was measured (red arrow) as 1,4×10⁻³ mm2/s, which in combination with morphological features proves the benign/reactive nature of the lymph nodes. References: Emergency County Hospital Cluj – Napoca, Romania")
 with multiple metastatic adenopathies. DWI (b=1000 s/mm2) showed a signal increase consistent with diffusion restriction (white arrow). The ADC value was measured (red arrow) as 1,3x10⁻³ mm2/s. DCE MRI scan shows the ROI (yellow outline) in the lymph node during the DCE sequence. The time-signal intensity curve (TIC) profile corresponds to type 3 (rapid uptake with low wash-out ratio) for these metastatic lymph nodes.
References: Emergency County Hospital Cluj – Napoca, Romania")
 stage I E B, developed on Hashimoto thyroiditis. MRI shows bilateral cervical lymph nodes (LNs) from IIb level superiorly to supraclavicular level inferiorly, mildly hyperintense on T2WI, with diffuse contrast enhancement (blue arrows), some with focal necrosis (N). The LNs compress the right internal jugular vein (red arrow), but the fat plane delineation is present. DWI (b=1000 s/mm2) showed a signal increase consistent with diffusion restriction (arrowhead). The ADC value was measured (yellow arrow) as 0,6x10⁻³ mm2/s .
References: Emergency County Hospital Cluj – Napoca, Romania")
, level II and III adenopathic blocks with cariokinetic features (*) and cerebral metastasis (white arrow). DCE MRI scan shows the ROI (white outline) in the lymph node during the DCE sequence. Notice that the ROI should be placed in the area of the LN that is not necrotic (red arrow). The time-signal intensity curve (TIC) profile corresponds to type 2 (slow uptake) for these metastatic LN. N = focal necrosis.
References: Emergency County Hospital Cluj – Napoca, Romania")
, displacing the internal jugular vein (IJV) anteriorly (red arrow) and causing a slow flow (blue arrow) in the IJV due to compression. The time-signal intensity curve (TIC) profile corresponds to type 2 = slow uptake. White outline – the ROI placed on the DCE-MRI scan.
References: Emergency County Hospital Cluj – Napoca, Romania")
 in the node during the DCE sequence, the image on B shows the ROI (white outline) in the thyroid gland. The time-signal intensity curve (TIC) profile corresponds to type 3 (rapid uptake with low wash-out ratio) for the node (blue curve 1), as well as for the thyroid parenchymal changes (yellow curve 2).
References: Emergency County Hospital Cluj – Napoca, Romania")
 thymus.
References: adapted from [2, 12].")
, anterior to the carotid/jugular vessels (blue arrow), extending from the upper to the middle neck region. The tissue signal is similar to the mediastinal thymus (arrowhead).
References: Case courtesy: Otilia Fufezan MD, Pediatric Emergency Hospital Cluj – Napoca, Romania")

 with one septum (arrowhead), situated posterolaterally to submandibular gland (blue arrow), laterally to carotid space (red outline) and anteromedially to sternocleidomastoid muscle (white arrows). The cyst is hyperintense on T2WI (black *), slightly hyperintense on T1WI due to proteinaceous content, with a peripheral wall enhancement on T1+C and substraction images (yellow arrows) (suggesting possible recurrent infection); no intracystic enhancement was found. The anatomical relationship is typical for a 2nd branchial cleft cyst type II after Bailey classification (adjacent to ICA – green arrow), which was also demonstrated on the histology exam after surgical cyst removal. References: Case courtesy: Assoc.Prof.Dr Horatiu Rotaru, Oral and Cranio-Maxillofacial Department, UMF Iuliu Hatieganu Cluj Napoca")