ECR 2020 / C-15291
Imaging IPF: from diagnosis to evaluating the effects of treatment in the era of antifibrotics
Congress:
ECR 2020
Poster Number:
C-15291
Type:
Educational Exhibit
Keywords:
Performed at one institution, Observational, Retrospective, Infection, Cysts, Diagnostic procedure, CT-High Resolution, Thorax, Lung, Chest
Authors:
F. Matos, S. Teixeira, P. M. R. C. Patrão, P. G. J. Magalhaes, P. Cruz, D. Silva; Viseu/PT
DOI:
10.26044/ecr2020/C-15291
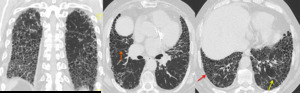
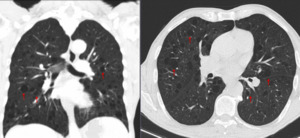
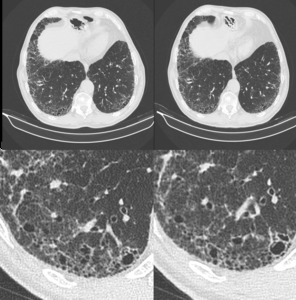
, bronchiectasis (orange arrow)
and extensive honeycombing (red arrow).")
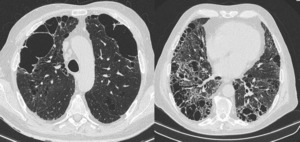
Fig. 1:
HRCT of a patient with a definite UIP pattern displaying all features for the...
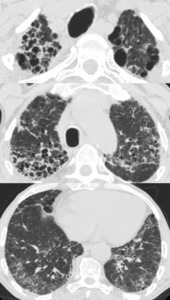
 are all elegantly displayed.")
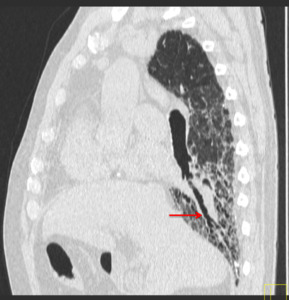
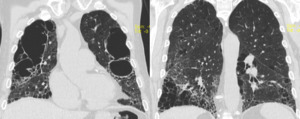
Fig. 2:
HRCT - sagittal reformat. Reticulation, honeycombing pattern and traction...
. Note the relative sparing of the subpleural lung parenchyma (yellow arrows) and the absence of cysts.")
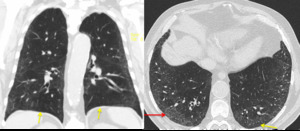
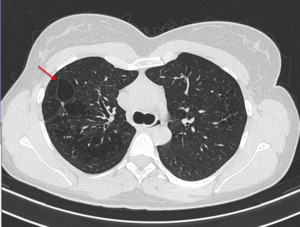
Fig. 3:
HRCT of a 64 year-old man displaying a NSIP pattern. There is a small...
 are observed. No signs of fibrosis, volume loss or other lung changes are visible.")
Fig. 4:
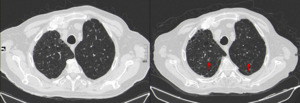
HRCT of a 35 year old woman with LAM. Several cysts distributed randomly across...

Fig. 5:
HRCT of patient with lymphoid interstitial pneumonia. Well defined cystic...
.")
Fig. 6:
HRCT of a patient diagnosed with Sjögren syndrome. Imaging features include...

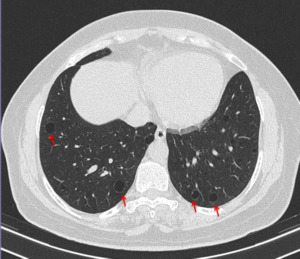
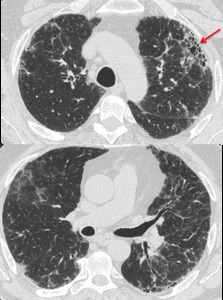
Fig. 7:
HRCT of a 78-year-old male patient with chronic hypersensitivity pneumonia:...
. This finding is known as the anterior upper lobe sign, described as being more common in patients with autoimmune disease.")
Fig. 8:
HRCT of a 76 year-old woman with Rheumatoid Arthritis. There is substantial...

Fig. 9:
HRCT of a 77-year-old male taking pirfenidone for a year, O2: 5L / min at rest;...

Fig. 10:
HRCT of the same patient of the previous picture: coronal reformat. There is...
.")
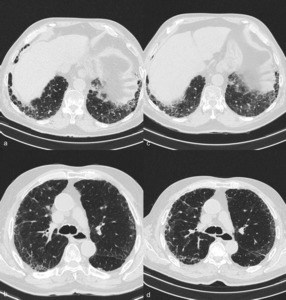
Fig. 11:
HRCT of a 80 year-old male patient, under pirfenidone. Follow up time: 9...
: there is an increase in fibrosis and lung density and reticular pattern despite the use of pirfenidone. Eventually, the patient required a lung transplant. Right image: after transplant - there is compensatory left hyperinflation and reduction of the right lung volume with a significant improvement in the patient's quality of life.")
Fig. 12:
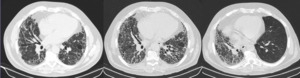
Serial HRCT of a patient with IPF under antifibrotic drug treatment. From left...
, related to respiratory infection.")
Fig. 13:
HRCT of a patient treated with nintedanib. Follow-up time: 1 year. There is a...

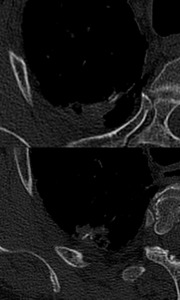
Fig. 14:
Diffuse pulmonary ossification. High attenuating structures, displaying a...

Fig. 15:
HRCT of a 72 year-old patient taking pirfenidone for IPF for over 18 months....