Body Phantom
We made a body phantom simulated from shoulder to pelvis using 3D printer (Agilista 3200, KEYENCE, Osaka, Japan). As shown in Fig. 3 , the cross-section of the phantom was 30 x 20 cm, and the length was 60 cm. X-ray transparency was adjusted by content fluid to simulate each region. The shoulder was filled with 3 mgI/ml diluted iodine contrast medium, backside of the chest was partially filled with water, the abdomen was filled by water, and the pelvis was filled with 3 mgI/ml diluted iodine contrast medium. An acrylic pipe filled with 10 mgI/ml of diluted iodine contrast medium, simulating the aorta, was inserted into the center of the phantom.
Image acquisition
We used 320-row detector CT scanner (Aquilion ONE GENESIS Edition, Canon Medical Systems, Otawara, Japan) with rapid-kV switching dual-energy system. Rapid-kV switching scans with and without AEC were performed to evaluate the performance of the AEC (Fig. 4). Both radiation exposures were adjusted to 10 mGy, the target SD was 8.0 when using AEC, the tube current was 330 mA when not using AEC. Images were reconstructed with spectral reconstruction, which is based on deep learning techniques, and 70 keV of virtual monochromatic X-ray images (VMI) were generated.
Evaluation
We evaluated (1) X-ray tube current on each slice, (2) radiation exposure of each region, and (3) image noise at each slice position in the phantom.
- As the X-ray tube current for each slice, the value on the DICOM tag (0018,1151) was recorded.
- Radiation exposure was measured using MOS-FET dosimeter (TN-RD-70W, AcroBio, Japan). The dosimeter was inserted at the front, back, left and right subsurfaces. In order to reduce the variation in measurement due to the position of the X-ray tube, measurement was performed five times, and the maximum value was used as the representative value.
- The standard deviation (SD) of the CT attenuation value on the content solution was measured as the image noise at each slice position. To avoid the effects of various artifacts, we did not record the SD at the transitions in each area.
Result: X-ray tube current
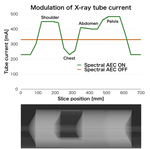
As shown in Fig. 5, with the AEC scan, the tube current changed in accordance with X-ray transparency despite the rapid-kV switching method. The use of appropriate tube currents for each region suggests that radiation exposure and image quality have been optimized. Due to system limitations, the minimum tube current is limited to 230 mA. The tube current may need to be lower than 230 mA in the chest.
Result: Radiation exposure
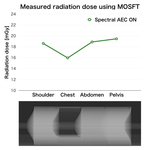
Fig. 6 shows radiation exposure measured using the MOS-FET dosimeter. As same as the X-ray tube current, radiation exposure modulated based on X-ray transparency. The reason why the measured value was higher than CTDIvol (10 mGy) was that the phantom for estimating CTDI and the phantom used this time were different.
Result: Image noise
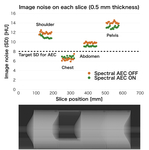
Fig. 7 shows the result of image noise on each slice. By enabling AEC, the image noise for each slice position was closer to the target-SD value (SD=8) compared to disabling AEC. Without AEC, image noise was widely distributed in each region, which means that the image quality was not homogeneous. High X-ray transparent regions such as shoulders and pelvis require high X-ray tube current. On the other hand, in regions with low X-ray transparent such as the chest does not require a high X-ray tube current, radiation exposure can be reduced by reducing the tube current. By using AEC, it is possible to homogenize the image quality and optimize the radiation exposure.
Representative case
Fig. 8 shows a case of contrast-enhanced CT scanned by the rapid-kV switching based DECT. X-ray tube current was modulated based on the scout image, and the image quality was uniform on the whole-body coronal view. Also, it was a DECT scan, we could use the iodine map to assess the contrast enhancement.


