All experimental procedures were performed in accordance with the National Institutes of Health guidelines for humane handling of animals, and was approved by the Animal Institutional Review Board at our institution.
Yorkshire-mix pigs weighing an average of 120 lb were used, and all procedures were performed with animals under general anesthesia. All vital signs including heart rate, respiratory rate, body temp, sp O2 and Co2 were continuously monitored by a certified vet technologist.
The pigs were placed in the supine position after adequate anesthesia was achieved. The entire upper abdomen was shaved and prepped and draped in standard sterile fashion. Both thighs were also shaved and grounding pads were placed bilaterally. Transverse and longitudinal ultrasound was performed of the liver, and hepatic parenchyma within 1 cm of the hepatic dome (adjacent to the diaphragm) was chosen for ablation.
------------------------------------------------------------------------------------
ABLATION TECHNIQUE:
A 15-gauge 3 cm RF probe (LeVeen needle electrode) was used for ablation. This needle electrode carries eight retractable curved tines which when fully deployed assume an umbrella shape 3 cm in maximum diameter perpendicular to the shaft of the probe.
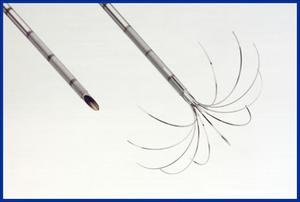
Fig.: The selected probe is based on the fact that radiofrequency ablation is usually performed with a one cm tumor-free margin around each tumor.
Power output was titrated according to the standards set by the RF system for a 3 cm probe. Titration terminated when maximal power output had been achieved without a rise in impedance for five minutes. Average time for lesion creation was 12 minutes (range, 8-16 minutes). Ablation was created by the use of a RF generator as the energy source.
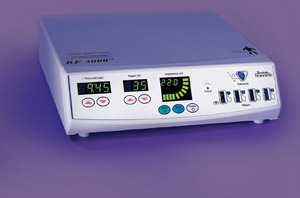
Fig.: Figure 6: The RF 3000 Generator (Boston Scientific) is an impedance-based feedback system which monitors the extent of tissue necrosis and permits continued delivery of RF energy until complete ablation is achieved.
Seven control lesions were performed. These control lesions were created by advancing the probe under ultrasound guidance, into the hepatic parenchyma and deploying the prongs within 1cm of the hepatic dome near the diaphragm.
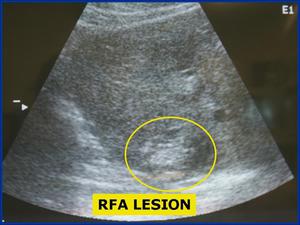
Fig.: Figure 5: Longitudinal ultrasound of the liver shows the characteristic hyperechoic lesion created with RF ablation. These lesions were all created within one cm of the liver surface.
------------------------------------------------------------------------------------
PROTECTIVE BALLOON TECHNIQUE:
Access to the peritoneum was made using the Seldinger technique. Under fluoroscopic guidance, access to the peritoneum was made through an intercostal mid-axillary approach with the use of a small micropuncture needle. A small amount of contrast was injected through the needle to observe appropriate localization within the peritoneum. An .018in wire was then advanced through the needle and was observed passing over the dome of the liver.
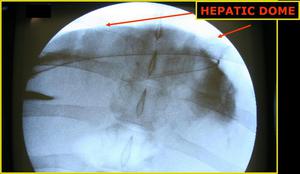
Fig.: Figure 6: AP fluoroscopic view demonstrates the wire passing over the hepatic dome from a right lateral percutaneous approach. Contrast is seen opacifying the correct location of the peritoneal space.
The needle was removed and a 5 French dilator was placed. An .035in guidewire was then manipulated under fluoroscopy over the dome of the diaphragm. The dilator was removed and an 18 x 4mm Blue-Max balloon angioplasty catheter was advanced over the wire and placed into several positions along the dome of the diaphragm during lesion creation.
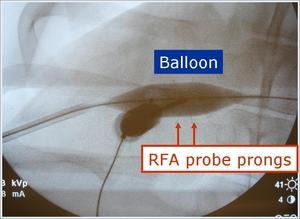
Fig.: Figure 8: Magnified AP view demonstrates the balloon inflated during RFA prong deployment.
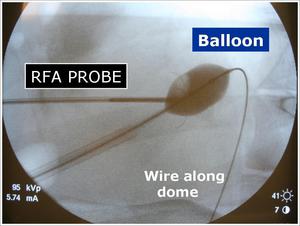
Fig.: Figure 9: Magnified lateral fluoroscopic view with the spine to the right of the picture. Again seen is the close proximity of the RFA prongs to the inflated balloon catheter.
The balloon was inflated with a mix of Renograffin and saline and maintained insufflated during RF lesion ablation. Using both fluoroscopic and sonographic guidance, the RF probe was advanced to within 1 cm of the hepatic dome, and tightly opposed to the balloon catheter. RF lesions were then created as described above.
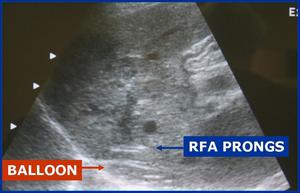
Fig.: Figure 10: Longitudinal ultrasound view through the liver demonstrates the RFA prongs deployed within 1 cm of the liver surface. The balloon catheter is seen interposed between the liver surface and the diaphragmatic edge.
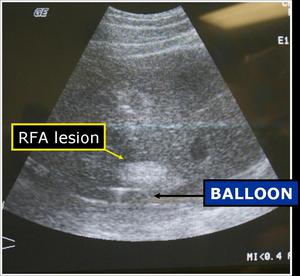
Fig.: Figure 11: Longitudinal ultrasound view shows the characteristic echogenic focus corresponding to the ablated lesion created in close proximity to the inflated protective balloon.
Approximately 25 lesions were created with the use of the protective balloon device.
------------------------------------------------------------------------------------
PATHOLOGY:
The pigs were sacrificed immediately following the procedure and the liver surface was inspected and sectioned to select lesions that have centers within 1cm of the surface. At post-mortem examination, the diaphragmatic surface adjacent to the lesion was inspected and photographed.
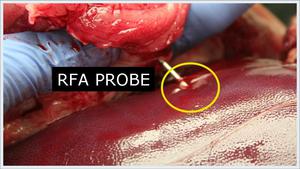
Fig.: Figure 12: Gross picture demonstrating the RFA probe device situated within the liver. The discoloration of the liver surface corresponds to ablated lesions.
The diaphragm was injured if a discolored segment was seen extending from the pleural to peritoneal margin.
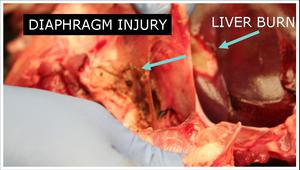
Fig.: Figure 13: Gross picture showing discolored segment of ablated liver lesion which extended through and through the peritoneal and pleural diaphragm, which also exhibits a characteristic discolored area. This lesion was created without the protective balloon device.
The areas of diaphragm corresponding to the ablated hepatic lesions were marked with a nylon suture. Using the method as described by Raman et al (2002), the areas of suspected diaphragmatic injury were graded on a scale of 0-3 with 0 being no injury and 3 representing severe full thickness injury. The injured areas of diaphragm, along with the areas of diaphragm that were marked with sutures, were then fixed and sectioned by a pathologist. The groups were then compared with respect to the severity of diaphragmatic injury.


