Imaging findigs OR procedure details
In our study we decided to perform MRI to patients that had previously negative DRE,
negative TRUS random biopsy and high PSA values.
The MRI examination included sequences for study of general pelvis and special sequences for the study of prostate gland as T2 weighted high resolution sequences [Fig 4],
diffusion weighted imaging [Fig 5] and perfusion technique.
Suspicious areas,
that were highlighted on axial T2 weighted images,
were classified as high,
moderate or low degree of cancer risk.
Suspicious lesions were detected by radiologists with over 5 years experience in reading prostate MRI.
The obtained data were transferred to a stereotactic biopsy system.
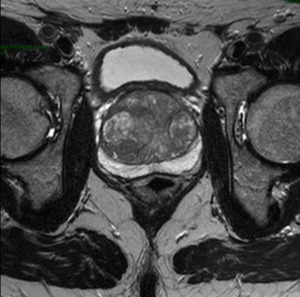
Fig. 4: TSE T2 high resolution weighted image of prostate
References: "Department of Radiology, San Bartolomeo Sarzana, Medical Hospital of Sarzana 2013."
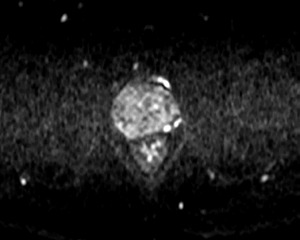
Fig. 5: Image of prostatic gland DWI b=1200. A small nodular areas were observed in the left prostatic lobe. The low signal intensity in TSE T2 high resolution image and rapid wash in observed in the perfusion sequences categorized these lesions as high suspicious.
References: "Department of Radiology, San Bartolomeo Sarzana, Medical Hospital of Sarzana 2013."
Patients
From April to December 2012,
15 patients (mean age of 61 year) with mean PSA level of 7.6 ng/ml and mean prostate volume of 42 ml were stereotactically biopsied .
All patients had already had a negative TRUS-guided biopsy and underwent 1.5 Tesla MRI with pelvic surface phased-array coil (PSFA) [Fig 6].
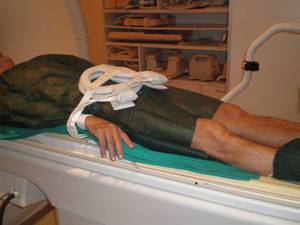
Fig. 6: Patient underwent 1.5 Tesla MRI with PSFA coil
References: "Department of Radiology, San Bartolomeo Sarzana, Medical Hospital of Sarzana 2013."
Prostate MRI scanning protocol :
- Achieva 1,5T MRI,
Philips Healthcare ;
- 18G cannula placed in a distal arm vein ;
- Gd BOPTA (Multihance®) 0,1 mmol/Kg; v perfusion 4 ml/sec ;
- Single scout: includes the pelvis ;
- Sequences of our protocol:
|
|
TR
|
TE
|
Slice thickness
|
Gap
|
TSE factor
|
NSA
|
|
TSE T2 SPAIR cor pelvis
|
Shortest
|
70
|
5
|
0,5
|
22
|
2
|
|
TSE T1 ax pelvis
|
400-700
|
8
|
5
|
0,5
|
6
|
4
|
|
TSE T2 Ax pelvis
|
Shortest
|
95
|
5
|
0,5
|
21
|
4
|
|
DWI pelvis
|
Shortest
|
Shortest
|
5
|
0,5
|
maximum
|
4
|
|
TSE T2 sag pelvis
|
Shortest
|
100
|
4
|
0,4
|
16
|
4
|
|
TSE T2 Ax prostate
|
Shortest
|
110
|
3
|
0,3
|
20
|
3
|
|
DWI Ax prostate
|
Shortest
|
Shortest
|
4
|
0,4
|
maximum
|
6
|
|
Perfusion prostate
|
Shortest
|
Shortest
|
1.4 x1.5 x3 mm
|
0,4
|
44
|
4
|
Transrectal Ultrasound protocol
- Ultrasound system Esaote My Lab 70 ;
- 7.5 MHZ transrectal probe ;
- Scanning begins in the axial plane,
and the base of the prostate and seminal vesicles were visualized first.; then the gland was examined by longitudinal plane.
A small amount of urine in the bladder facilitates the examination.
MRI and ultrasound guided prostate biopsy using the fusion imaging technique
- Interruption of anticoagulants (such as warfarin,
aspirin or clopidogrel),
rectal enema and administration of antibiotics in previous days before the biopsy was used in order to prevent blooding and infection.
- Patient needs to lie down on his left side and a transrectal approach was used.
A small amount of anaesthesia was injected.
- To fuse T2 high resolution sequence to US image,
the prostate gland apex or specific zones into prostate adenoma,
such as calcifications or fluid area,
were searched in both images.
When the same image fusion was obtained,
a coregistration was performed.
[Fig.7]
- The suspicious areas,
detected on the T2 weighted image,
were automatically localized by a target on the ultrasound image.
[Fig.8]
- The biopsy was finally performed on the localized target.
- At the end of the specific biopsies,
a random biopsy was also executed.
- Possible complications are: post interventional hemorrhage or urinary tract infection.
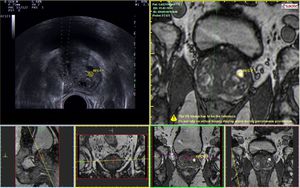
Fig. 7: Ultrasound image and TSE T2 high resolution weighted image of prostate. A fluid area (yellow target) was searched in central adenoma on US image appearing as hypoechoic and the same image of high signal intensity in TSE T2 sequence was found. Under the upper images MPR images of prostate gland.
References: "Department of Radiology, San Bartolomeo Sarzana, Medical Hospital of Sarzana 2013."
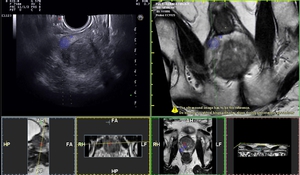
Fig. 8: Upper images: Ultrasound image and TSE T2 high resolution weighted image of prostate. A low signal intensity area (blue target) was marked in TSE T2 image in the right prostatic lobe and the same area was identified on US by fusion imaging technique . Lower images: MPR images of prostate gland.
References: "Department of Radiology, San Bartolomeo Sarzana, Medical Hospital of Sarzana 2013."
