ECR 2016 / C-1209
What emergency and general radiologists should know about vascular (potentially) reversible brain disorders: Cerebral venus thrombosis (CVT), Posterior Reversible Encephalopathy Syndrome (PRES) and Reversible Cerebral vasoconstriction Syndrome (RCVS)
This poster is published under an open license. Please read the disclaimer for further details.
Congress:
ECR 2016
Poster Number:
C-1209
Type:
Educational Exhibit
Keywords:
Neuroradiology brain, MR, CT, Education, Haemorrhage, Oedema, Ischaemia / Infarction
Authors:
M. Carrillo García1, M. Tovar Pérez2, E. Cruces Fuentes3, C. Botía González2, A. Moreno Pastor4, J. M. Garcia Santos2; 1Cartagena/ES, 2murcia/ES, 3Murcia, MU/ES, 4Espinardo (Murcia)/ES
DOI:
10.1594/ecr2016/C-1209

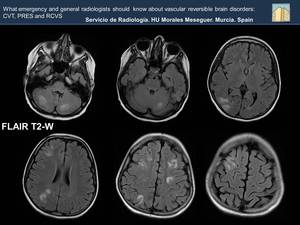
Fig. 17
, and precuneus, (Image B) , are noted. A small hyperintense lesion is shown in right frontal lobe. The appearance and distribution of the lesions suggests a possibility of PRES.
References: Department of Radiology, Hospital General Universitario Morales Meseguer")
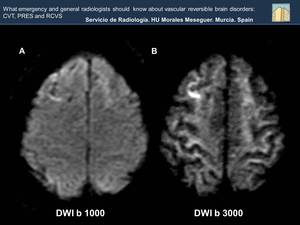
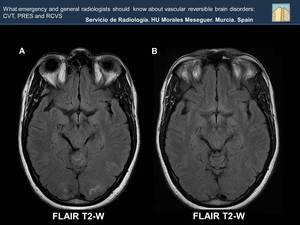
Fig. 18:
Bilateral and simmetrical subcortical hyperintensities in occipital lobes...
 . Increase of ADC value in left occipital lobe (white arrow, Image B). These findings are due to vasogenic edema.
References: Department of Radiology, Hospital General Universitario Morales Meseguer")
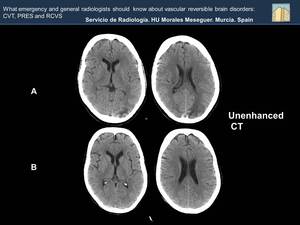
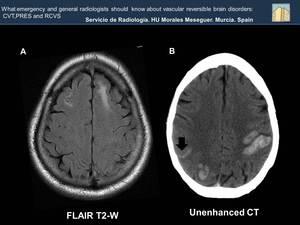
Fig. 19:
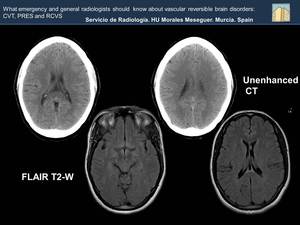
Hypodensity with finger morphology in left occipital subcortical white matter...
, has disappeared as we see in the CT carried out a few month later (Image B).
References: Department of Radiology, Hospital General Universitario Morales Meseguer")
Fig. 20:
What characterizes PRES is the reversibility of the lesions. Hypodensity of...

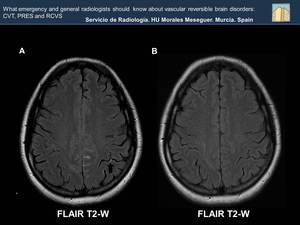
Fig. 22:
The FLAIR sequence shows multiple , bilateral and rather symmetric hyperintense...

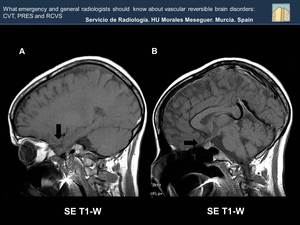
Fig. 21
 , and a narrowing of the sellar cistern (black arrow, Figure B).
References: Department of Radiology, Hospital General Universitario Morales Meseguer")
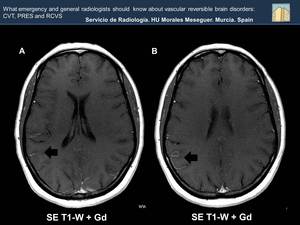
Fig. 23:
Increased intracranial pressure causes a descent of frontal lobe (black arrow,...
 . As time passes you can see edema (red circle, Image B).
References: Department of Radiology, Hospital General Universitario Morales Meseguer")
Fig. 24:
At first the CT may be normal (Image A) . As time passes you can see edema (red...
. Increasing density on the back of the superior sagital sinus (SSS) because of thrombosis (Image B). The involvement of the SSS is related to bilateral intraparenchymal hemorrhages as seen in this patient. A subarachnoid hemorrhage (black arrow) is also noted.
References: Department of Radiology, Hospital General Universitario Morales Meseguer")
Fig. 25:
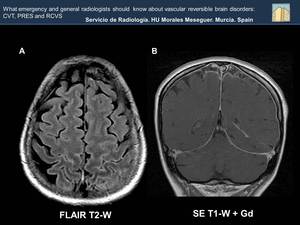
FLAIR sequence shows hyperintensity in subcortical white matter of both frontal...

Fig. 26:
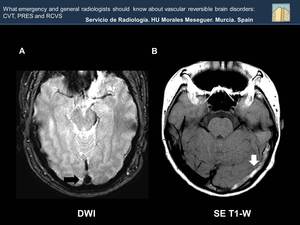
Diffusion MRI is not the best technique to evaluate venous thrombosis, because...
 in the early days , in more conspicuous than T1, T2 and FLAIR hyperintensity in the veins /sinus thrombosis . Transverse sinus thrombosis (white arrow, Image B).
References: Department of Radiology, Hospital General Universitario Morales Meseguer")
Fig. 27:
The blooming sign (black arrow, Image A) in the early days , in more...

Fig. 28:
Image A: Restricted diffusion in the posterior portion of the superior sagital...

Fig. 29:
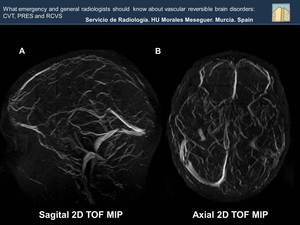
The absence of flow of the venous venous sinuses is well assessed in MR...

Fig. 30:
The absence of flow of the venous venous sinuses is well assessed in MR...

Fig. 31

Fig. 32:
At the beginning studies may be normal, so if there is a high clinical...
 occupancy of the sulci of the middle convexity with hyperintense lineal material compatible with subarachnoid hemorrhage is shown References: Department of Radiology, Hospital General Universitario Morales Meseguer")
Fig. 33:
In both T2 weighted images( Image A and B) occupancy of the sulci of the middle...
 vessesls engorgement related to vascular slowdown is observed (Black arrows).
References: Department of Radiology, Hospital General Universitario Morales Meseguer")
Fig. 34:
In both images (A and B) vessesls engorgement related to vascular slowdown is...
 are displayed ( Image A). These findings have disappeared as we see in the MRI carried out a few month later (Image B)
References: Department of Radiology, Hospital General Universitario Morales Meseguer")
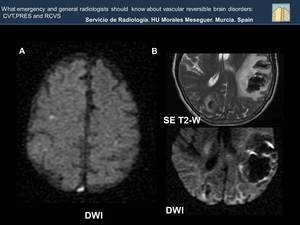
Fig. 37:
Occupancy of the sulci of the middle convexity with hyperintense linear...
. A more obvious edema-ischemic of the cortical white matter (Image B). The findings are compatible with a cortical bleeding and edema-ischemic in surrounding subcortical white matter.
References: Department of Radiology, Hospital General Universitario Morales Meseguer")
Fig. 35:
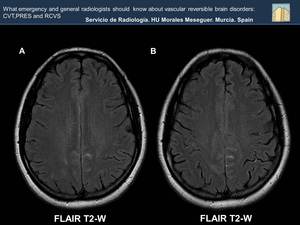
Linear hyperintensity of gyriform morphology with hypointensity of the adjacent...
. In a posterior control, the resolution of edema is shown (Image B). Imaging findings secondary to reversible cerebral edema, wich has a similar distribution of the PRES.
References: Department of Radiology, Hospital General Universitario Morales Meseguer")
Fig. 36:
Bilateral hyperintensity with a finger-morphology in the subcortical occipital...
.
References: Department of Radiology, Hospital General Universitario Morales Meseguer")
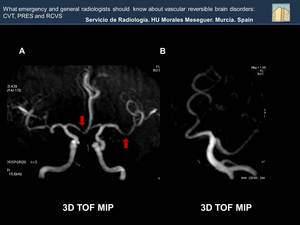
Fig. 38:
In both images scattered bilateral small foci of vascular stenosis are...