Teratomas had heterogeneous signal at all type of MRI images and heterogeneous type of contrast enhancement (p=0,06).
Signal intensity inversion on T2WI (mean and low signal) and T1WI (high signal) for endometriomas was found in all cases.
MOT and mature cystic teratomas and endometriomas showed high signal intensity on DWI (p=0,007) with low ADC values (Fig 1,2,3).
Fibromas and other BOT showed low signal intensity on DWI with ADC values (p<0,001) (Fig 4,5).
But there was not significant difference on DWI and on ADC maps between BOT and MOT even in cyst and solid components of the OT (p=0,08).
The difference of the time dependence intensity curves for DCE-MRI was found between the BOT and MOT groups (p<0.0001).
Three main types of signal dependence on the time after gadobutrol injection were determined: type I - with gradual monotonous signal rise,
type II - with gradual monotonous rise with the subsequent formation of a plateau,
type III - with rapid and active rise and with a subsequent signal secrease.
The curve of the type III appeared specific for MOT.
The curve of the type I was specific for BOT (p=0.01) (Fig 6,7).
In all cases EAr,
MSr and IAUC60 ratio were higher for MOT in compare with BOT (p<0.0001).
The IAUC60 ratio was the most relevant factor for BOT and MOT differentiation.
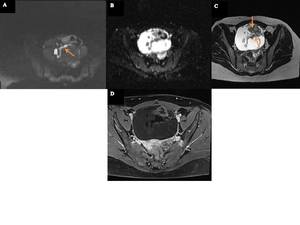
Fig. 1: Fig1. A 68-year-old patient with mature cystic teratoma of the ovary. Solid components (floating debris, teeth, soft-tissue and protuberances Rokitansky nodules) (arrows) have hyperintensity signal on DWI (A). The mean and lowest ADC values (B) of the solid components are 0.85x10⁻³ and 0.78x10⁻³ mm2/s, respectively. The cystic lesion shows hyperintensity signal T2WI (C). Heterogeneous type of postcontrast enhancement on T1WI with fat suppression (D).
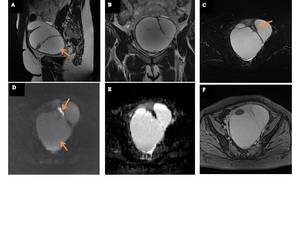
Fig. 2: Fig 2. A 44-year-old patient with cystic ovarian endometriosis (right ovary). The cystic lesion (arrows) has relative hypointensity signal on T2WI (A,B), T2WI fat-suppressed (C) and hyperintensity signal on DWI (D). Corresponding ADC maps (E): ADC values of the endometrial cystic were 0.49, 1.16 and 1.43x10⁻³ mm2/s. Postconrast fat-suppressed T1WI (F) shows high intensity signal of the cystic formation due to hemorrhagic components and hyperintensity type enhancement around capsule of the cystic formation.
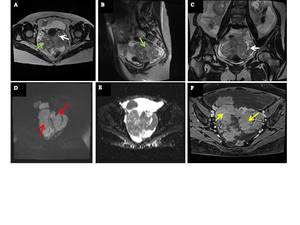
Fig. 3: Fig 3. A 51-year-old patient presented with serous adenocarcinoma of the ovarian. A solid mass (green arrows) and small cystic nodes (white arrows) have high intensity signal on T2WI (A,B,C) and hyperintensity signal on DWI (red arrows) (D). The mean and lowest ADC (E) values of the tumor mass are 0,60x10⁻³ mm2/s and 1,43x10⁻³ mm2/s. Postcontrast fat-suppressed T1WI (F) shows homogeneous and intense internal enhancement (yellow arrows).
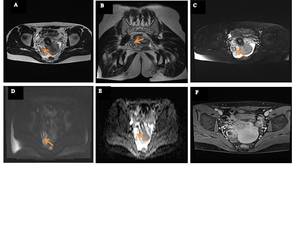
Fig. 4: Fig. 4: Fig 4. A 38-year-old patient with fibroma of the ovary. The solid ovarian tumor predominantly shows hypointensity with intervening hyperintensity on T2WI (A,B), T2WI fat-suppressed (C) (orange arrows), low and moderate signal intensity on DWI (D). The mean and lowest ADC (E) – values of the mass are 0.94, 1.72 and 1.1 x10⁻³ mm2/s, respectively. Postcontrast fat-suppressed T1WI (F) shows homogeneous and intense internal enhancement.
Fig. 5: Fig 5. A 69-year-old patient with serous benign cystadenoma of the ovary. T2WI shows a unilocular cystic mass with a thin regular wall (A, B). Serous fluid has high signal intensity (red arrows) on T2WI (A, B) and has low signal intensity on T1WI (C) (blue arrow). The thin regular wall demonstrates low signal intensity on DWI (D) (black arrow). The mean and lowest ADC (E) – values of the serous cystadenoma are 1.56 and 1.87 x10⁻³ mm2/s, respectively. The cystic wall shows to moderate contrast enhancement on contrast-enhanced fat-suppressed T1WI (F) (orange arrow).
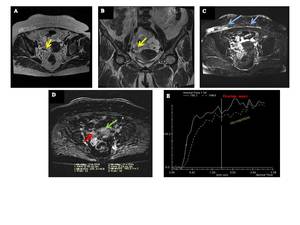
Fig. 6: Fig 6. A 76-year-old patient with ovarian high-grade serous adenocarcinoma. On T2WI the solid component has intermediate signal intensity (A, B) (yellow arrows). T2WI demonstrates bilateral ovarian masses with metastasis (blue arrows) in a fat tissue of the anterior abdominal wall (C). On DCE T1WI the solid component (red arrow) shows obvious contrast enhancement compared with the myometrium (green arrow) (D). The solid component shows a curve of type III (a rapid rising with a plateau pattern) (E).
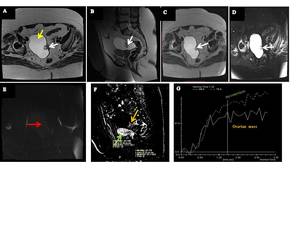
Fig. 7: Fig 7. A 67-year-old patient with borderline serous ovarian cystadenoma with small papillary component (atypical cells or possible low grade cystadenocarcinoma?). T2WI (A,B), T2WI fat-suppressed (D) and T1WI (C) demonstrates right ovarian unilocular cystic mass with high signal on T2WI (A - yellow arrow) with papillary component arising from the medial wall which has low signal intensity on T2WI, T1WI and on fat-suppressed T2WI (A, B, C, D - white arrows) and moderate signal intensity on DWI (E - red arrow). On DCE T1WI (F) the papillary component (orange arrow) showed weak contrast enhancement in compare with the myometrium (green arrow). The solid component showes a curve of the type I (a rapid rising with plateau pattern) (G).
