ECR 2018 / C-1891
Timed barium swallow in the assessment of esophageal emptying in patients with achalasia: How to do it and what to look for
Congress:
ECR 2018
Poster Number:
C-1891
Type:
Educational Exhibit
Keywords:
Gastrointestinal tract, Fluoroscopy, Barium meal, Technical aspects, Dynamic swallowing studies, Swallowing disorders, Motility, Eating disorders, Stomach (incl. Oesophagus)
Authors:
M. A. Serrano1, I. V. Toledo Coronado2, D. Butrón Hernández3, E. M. León Guerrero1; 1Mexico/MX, 2Cd de México/MX, 3PACHUCA, HGO./MX
DOI:
10.1594/ecr2018/C-1891

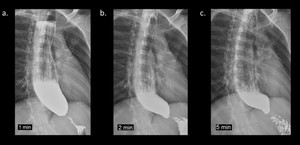
Fig. 8:
Time barium esophagogram in a 29 year old woman with achalasia. Spot film 1,2...
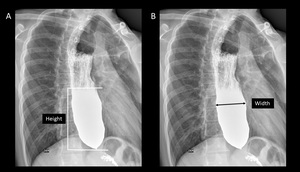
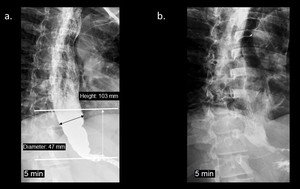
 The barium height is measured from the the bird´s beak (distal esophagus at the level of LES) to the top of the barium column at the level at which the barium-foam interface is best defined. B)The width is measured perpendicular to the approximated long axis at its widest point. References: Radiology Department, Instituto Nacional de Ciencias Médicas y Nutrición Salvador Zubirán. México/MX")
Fig. 9:
Quantitative analysis. A) The barium height is measured from the the bird´s...

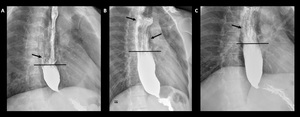
Fig. 10:
Barium-foam interface. A, B and C, three different cases with barium-foarm...

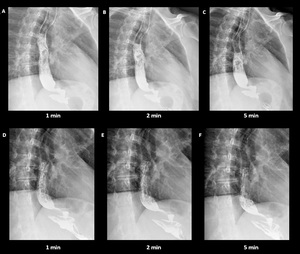
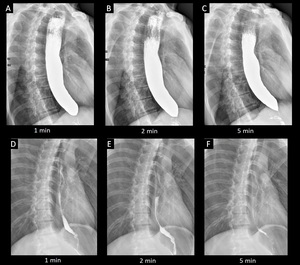
Fig. 11:
Interpretation of timed barium esophagogram. Radiographs taken 1, 2 and 5...
, 2 (B), and 5 minutes (C), shows a dilated esophagus and barium retention. Following Heller Myotomy, same examination (D, E, F) shows near complete esophageal emptying at 5 minutes. References: Radiology Department, Instituto Nacional de Ciencias Médicas y Nutrición Salvador Zubirán. México/MX")
Fig. 12:
Evaluation of treatment response. Baseline time barium esophagogram at 1 (A), 2...
, 2 (B), and 5 minutes (C), shows the typical imaging findings in a patient with achalasia. Following pneumatic dilation, same examination (D, E, F) shows complete esophageal emptying at 2 minutes. Patient referred complete relief of all symptoms. References: Radiology Department, Instituto Nacional de Ciencias Médicas y Nutrición Salvador Zubirán. México/MX")
Fig. 13:
Evaluation of treatment response. Baseline time barium esophagogram at 1 (A), 2...

Fig. 14:
Interpretation of baseline and post myotomy timed barium esophagogram in a...