Study selection
Between November 2017 and February 2018,
100 patients were retrospectively collected with suspicious focal solid hepatic lesions that underwent routine MRI of the upper abdomen.
The inclusion criteria were:
- presence of solid FLLs;
- diameter lesion > 1cm;
- not previously treated FLLs before MRI
- histopathological confirmation after surgery or biopsy (in case of metastasis);
- at least four follow up for B FLLs with typical imaging feature of FNH.
Data acquisition
Patients were scanned on a 1,5 T MR scanner (MAGNETOM Avanto,
Siemens Healthcare,
Erlangen,
Germany) with 32 channels body coil.
A routine MRI acquisition protocol was performed.
The dynamic study was effectuated before and after injection of hepatobiliary contrast agents.
The hepatobiliary contrast medium used were:
- Gadobenate dimeglumine (Gd-BOPTA - MultiHance,
Bracco Milano Italy)
- Gadoxetic acid (Gd-EOB-DTPA - Primovist Bayer Healthcare,
Leverkusen Germany)
Hepatobiliary phase images were acquired at 120 and 20-30 minutes in patients injected respectively with MultiHance and Primovist.
DWI parameters
DWI echo-planar imaging (EPI) respiratory triggered with multiple "b" values was always obtained before injection of contrast medium.
There were three orthogonal gradient directions,
the image parameters were: TR/TE:4800/54 milliseconds; FOVread: 400mm; slices 20,
slice thickness/gap = 6/1 mm; spectral fat saturation; b values = 0,
10,
20,
30,
50,
80,
100,
200,
400,
600,and 800 s/mm2; and number of excitations = 3.
Image analysis
Image data were anonymised using DicomBrowser.
Free-hand regions of interest (ROI) were drawn directly on diffusion-weighted images to match the liver lesion to its full extent,
while avoiding surrounding vessels or bile ducts structures seen macrographically.
(Fig. 1)
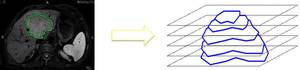
Fig. 1
References: Department of Radiology Ca'Foncello Regional Hospital (Treviso Italy)
For each lesion,
outlining was performed by a radiologist in training with 5 years' experience on the b = 400 s mm-2 diffusion-weighted image for each patient,
using the closed polygon ROI tool in OsiriX and validated by a second radiologist with 15 years' experience.
The multiple OsiriX ROIs on different image slices were transformed into RT-STRUCT files (one per lesion),
each containing multiple contours,
using custom-written code running inside the open-source pyOsiriX plugin.
Finally,
custom-written code in MATLAB was used to create IVIM maps from which the relevant regional and cohort statistics were obtained.
The IVIM signal model is given by
S(b) = S0[f.exp(-bDs) + (1-f).exp(-bD)]
Parameter maps were created using voxel-wise least-squares fitting to the above signal equation with the following constraints:
0 < f < 1,
10 < D < 104,
103 < Ds < 2×10⁵ and D < Ds.
Least-squares minimisation was performed using the matlab function fminsearch and the parameter constraints were incorporated by transforming the parameters with x = xMIN + (xMAX ‑ xMIN)cos2(y).
In this expression,
“y” is the variable adjusted by fminsearch,
“x” is the corresponding IVIM parameter (each of f,
D and Ds) and xMAX and xMIN are the corresponding parameter limits. Maps of the ADC (fitted to all b-values) and the derived parameter fDs were also obtained.
Statistical analysis
According to the signal intensity obtained from the 11 “b” values the relationship between them could be described by a biexponential model in each group.
Lesions were classified into five groups (benign,
malignant,
hypervascular malignant,
hypovascular malignant and hypervascular benign) and comparison was made between four groups:
- Benign VS Malignant group;
- Hyper vascular Benign VS Hyper vascular Malignant;
- Hypervascular Malignant VS Hypovascular Malignant.
A comparison between FNH and Adenoma was made.
All quantitative data were reported as mean (ME) ± standard deviation (SD).
The nonparametric Mann-Whitney U test was used to compare the mean,
median,
std,
skewness,
kurtosis and entropy calculated respectively for ADC and the IVIM-derived parameters (f,
D,
Ds and fDs) between the four groups.
To assess the diagnostic performance for those parameters which showed statistically significant differences ROC curves were assessed.
The Youden’s index was used to capture the performance of ROC curves.
Results with P value less than 0,05 were considered statistically significant.

")