A total of 33 patients (42 rectal MR scans) were retrieved from the hospital’s PACS system between November 2016 and October 2017 to be potentially included in this retrospective study; informed consent was waived.
Inclusion criteria were: pathology proven solid (non-mucinous) rectal cancer; availability of DWI-MR scan (primary staging and/or restaging after neoadjuvant treatment before surgery) of the rectum including b1000 and b2000 images. (Fig.1 - Inclusion and exclusion criteria)
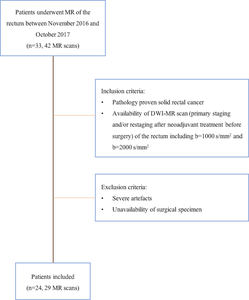
Fig. 1: Flowchart with inclusion and exclusion criteria
References: Department of Radiology and Bioimaging, "G. D'Annuzio" University, Chieti-Pescara, "Ss. Annunziata" - Chieti - Chieti/IT
A state-of-the-art 3.0T scanner (Achieva,
Philips Medical System,
Best,
the Netherlands) was used to perform MR exams equipped with phased array surface coil.
Notably,
we acquired transverse echo planar DWI including b1000 and b2000 as the two highest b-values.
The transverse T2W and DWI sequences were acquired in identical planes,
perpendicular to the long axis of the tumor.
If bowel movement artefacts were present on the T2-weighted sagittal planning scan,
patients received 20 mg of scopolamine butylbromide (Buscopan,
Boehringer Ingelheim,
Ingelheim am Rhein,
Germany) intravenously to reduce bowel motility.
From March 2017 patients also routinely received 5 ml of ultrasound gel ± 5 minutes before the examination to reduce the presence of air in the rectal lumen (performed in 21/29 scans).
Qualitative analysis
An expert radiologist (Reader 1) with specific experience in rectal MR and a radiologist in training (2nd year) with no specific previous experience in reading rectal MR (Reader 2),
independently assessed the presence of tumor and tumor conspicuity on b1000 and b2000 images by using a 4- point scale: (0) absence of tumor; or in case of (suspected) tumor presence: (1) hyperintense lesion,
but only slightly demarcated from the background,
(2) hyperintense lesion with good background suppression,
tumor clearly demarcated from the background,
(3) very high hyperintensity lesion with excellent background suppression.
The T2 weighted images were at the readers’ disposal for anatomical reference during the evaluation.
Data were anonymized and scored in two reading sessions: in the first ,
the readers reviewed one b-value (randomly chosen) and in the second,
two weeks later,
they reviewed the other b-value.
Quantitative analysis
To quantitatively assess the tumor conspicuity,
we compared the signal intensity distribution of the tumor and of the immediate sorrounding tissue.
Tumor delineation was performed using an opensource medical image computing platform,
3DSlicer Version 4.8 (www.3dslicer.org).
Both readers provided a whole tumor volume manual delineation on DWI images referring to T2-weighted images for anatomical reference.
Subsequently,
the region of interest of the tumor (ROI-T) was dilated by eight voxels using the corresponding morphological binary operator (ROI-T “dilated”).
The tumor surrounding tissue (ROI-TST) was computed by subtracting ROI-T from ROI-T “dilated”.
(Fig 2).
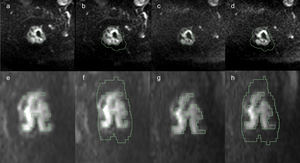
Fig. 2: Regions of interests (ROI) selected in a MRI study of a 48-year-old woman with rectal
cancer. The ROI representing the rectal tumor delineation (a, c) and the tumor surrounding tissue
(b, d) were showed in the axial plane on b=1000 s/mm2
(a, b) and b=2000 s/mm2
(c, d)
respectively. The whole tumor (e, g) and the whole tumor surrounding tissue (f, h) segmentations
were shown in the sagittal plane on b=1000 s/mm2
(e, f) and b=2000 s/mm2
(g, h) respectively.
References: Department of Radiology and Bioimaging, "G. D'Annuzio" University, Chieti-Pescara, "Ss. Annunziata" - Chieti - Chieti/IT
A circular 5 mm2 region of interest was also placed in the adipose tissue of the gluteal region in order to normalize data (NORM-T,
and NORM-TST respectively).
Statistical Analysis
Distribution normality was tested via Shapiro-Wilk test.
The Mann-Whitney test was used to compare the qualitative scores between the b1000 and b2000 diffusion weighted images for each reader.
The independent sample t-test was used to test for quantitative differences between the b1000 and b2000 DWI in terms of mean signal intensity,
variance,
10th percentile and 90th percentile in the tumor and in the surrounding tissues.
The interobserver agreement (IOA) for the qualitative and quantitative data was calculated through the use of Cohen's Kappa and Intraclass Correlation Coefficient (ICC) respectively.
ICC was calculated by using MedCalc software,
version 16.8.4 (MedCalc Software,
Ostend,
Belgium).
All other statistical analyzes were performed using IBM SPSS Statistics software,
version 20 (IBM,
Armonk,
NY).
A p-value ≤ 0.05 was considered statistically significant.


 selected in a MRI study of a 48-year-old woman with rectal
cancer. The ROI representing the rectal tumor delineation (a, c) and the tumor surrounding tissue
(b, d) were showed in the axial plane on b=1000 s/mm2
(a, b) and b=2000 s/mm2
(c, d)
respectively. The whole tumor (e, g) and the whole tumor surrounding tissue (f, h) segmentations
were shown in the sagittal plane on b=1000 s/mm2
(e, f) and b=2000 s/mm2
(g, h) respectively. References: Department of Radiology and Bioimaging, "G. D'Annuzio" University, Chieti-Pescara, "Ss. Annunziata" - Chieti - Chieti/IT")