Knee MR studies between 2006 and 2018 were retrospectively reviewed.
Patients were included if they had undergone two different knee MR studies,
the first made in 2006 or 2007 and the second with a latency period of at least 3 years. We found 196 patients who had two knee MRI,
both left or right knees.
MRI were performed using three different 1.5-T systems (Phillips Ingenia,
Phillips Achieva and Phillips Intera) with a dedicated knee coil. Patients were placed in the supine position with the knee extended at the maximum extension allowed by the coil,
although always with a slight flexion.
A radiologist with 10 years of experience in musculoskeletal radiology reviewed all MR studies looking for edema in the superolateral part of Hoffa fat pad in coronal STIR and axial SPIR DP sequences.
We observed 35 patients with edema in the superolateral part of Hoffa fat pad who formed the SHFP impingement group. Control group consisted of 18 patients.
Exclusion criteria for both groups were incomplete data,
history of surgery or acute injury previous the first study or surgery or trauma between the MR studies.
In order to stablish and confirm the relationship between SHFP and patellofemoral maltracking,
we evaluated different instability parameters in SHFP impingement and control groups not only in the first study but also in the second exam using sagittal T1 and axial T2 weighted images.
The measurements were performed using the PACS system and Siemens Syngo Via VB30 software.
- Trochlear facet asymmetry(TFA). It is calculated as the ratio of the length of the medial trochlear facet to the length of the lateral trochlear facet measured at 3 cm above the tibiofemoral joint cleft.
A trochlear facet ratio of less than 0.4 is defined as indicating dysplasia(Figure 2).
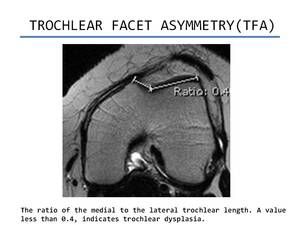
Fig. 2: Trochlear facet asymmetry
References: Department of Radiology. Hospital POVISA. Vigo
- Sulcus angle (SA). On axial images 3 cm above the joint line,
sulcus angle is measured between lines paralleling cortex of femoral trochlea.
On MRI it can be calculated using subchondral bone or the articular cartilage.
Measurements from the articular cartilage may be more relevant because it constitutes the actual joint surface.
However,
we have used the subcondral bone.
Normal femoral sulcus angle is < 144º(Figure 3).
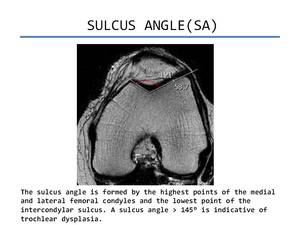
Fig. 3: Sulcus angle
References: Department of Radiology. Hospital POVISA. Vigo
- Trochlear inclination (TI). It is the angle formed between the plane of subchondral bone of the anterior condyles and an tangential line through posterior femoral condyles (Figure 4).
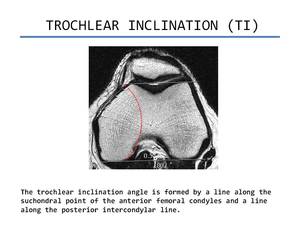
Fig. 4: Trochlear inclination
References: Department of Radiology. Hospital POVISA. Vigo
- Patellar height ratio (Insall-Salvati). It is calculated as the length of the patellar tendon measured posteriorly from the apex of the patella to its attachment to the tibial tuberosity on a sagittal MR image,
divided by the longest superoinferior diameter of the patella.
The normal patellar height ratio reported is 1.1(standard deviation,
0.1).
Patella alta is defined as a patellar height ratio of more than 1.3 (Figure 5).
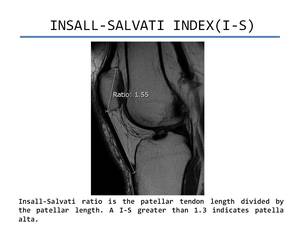
Fig. 5: Insall-Salvati Index
References: Department of Radiology. Hospital POVISA. Vigo
- Tibial tuberosity-trochlear groove distance (TT-TG). A line tangential(TL) to the posterior condyles is drawn from the axial plane,
coursing through the deepest point of the trochlea groove (where the femur presents as a Roman arch).Then,
this line is transposed to the most cephalad image of the tibia tubercle in which the patellar tendon insertion is identified.
On this image the width of the tibial tubercle is measured and halved to define the centre of the tubercle.
The perpendicular distance between the centre of the tibial tubercle on this image and the first line (TL) is the TT-TG.
A TT-TG less than 15 mm is considered normal.
Distances between 15 and 20 mm are borderline,
and distances of more than 20mm indicate marked lateralization of the tuberosity.
(Figure 6).
This measurement varies depending of the knee flexion and it is also difficult to estimate in dysplasic trochlea(Figure 6).
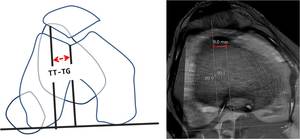
Fig. 6: TT-TG
References: Department of Radiology. Hospital POVISA. Vigo
- Tibial tubercle-posterior cruciate ligament distance (TT-PCL). The protocol was described by Seitlinger et al.
First,
the insertion of the PCL on the tibia is located by identifying the most caudal axial image slice in which the PCL is seen.
An horizontal reference line is drawn along the dorsal aspect of the proximal tibia.
Perpendicular to this reference line,
another line (PL) is drawn adjacent to the medial aspect of the PCL.
The PL is then transposed to the most cephalad image of the tibial tubercle in which the patellar tendon insertion is visualized.
The centre of the tibial tubercle is defined as the TT-TG technique described before.
The perpendicular distance between the centre of the tibial tubercle and the PL is the TT-PCL measurement (Figure 7).
It has been established than TT-PCL is independent of femoral anatomy and anteversion.
This measurement does not variate with knee flexion and quantifies the position of the tibial tubercle independent of the shape of the trochlea and with respect to the tiba only (Figure 7).
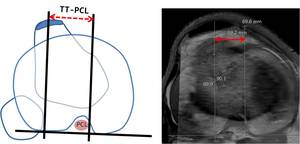
Fig. 7: TT-PCL
References: Department of Radiology. Hospital POVISA. Vigo
- Patella morphology (Wiberg classification).
Patella Wiberg 1 or "a" is when medial and lateral facets are concave and have the same size; Patella Wiberg 2 or "b" is when the medial facet is slighly smaller and facets are concave; Patella Wiberg 3 or "c" is when the medial facet has markedly smaller size and vertical orientation and convex edge (Figure 8).
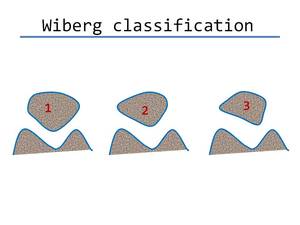
Fig. 8: Wiberg classification
- Lateral patellofemoral angle (LPFA). It is estimated as the angle between a line drawn along the bony lateral patellar facet and a line drawn along the anterior aspect of the condyles.
A patellofemoral angle opening laterally is considered normal.
An angle opening medially indicates patellar tilt(Figure 9).
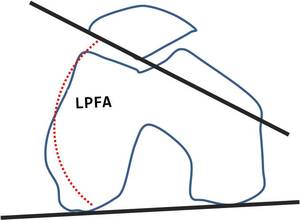
Fig. 9: LPFA
All of these paremeters were calculated in both groups,
not only in the first study but also in the second study (Figure 10-11)
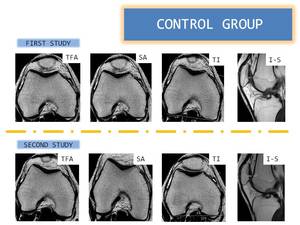
Fig. 10: Measurements in control group
References: Department of Radiology. Hospital POVISA. Vigo

Fig. 11: Measurements in SHFP impingement group
References: Department of Radiology. Hospital POVISA. Vigo
We compared the measurements in SHFP impingement and control groups and variability of the parameters between first and second MR exams. The data were analyzed using SPSS Statistics software.
The mean and standard deviation(SD) were calculated.
A paired t-test compared the values in the diagnosis and posterior study.
An unpaired t-test compared the control and knee impingement group with respect to the TT- TG and TT-PCL.
For categorical analyses two cutoffs were used: one from the literature and one calculated from the current study.
The literature references used were ≥20 mm for the TT-TG and ≥24mm for the TT-PCL. For the current study,
the abnormal values were calculated based on 2SD from the control population,
meaning 5% of the control population would be above the limit with a normal distribution.
Statistical significance for all the test were determined by a p <0.05.
We also evaluated the severity and stability of edema in the different MR studies.


