ECR 2020 / C-00553
Back to basics in foot and ankle: A practical approach to plain radiography
Congress:
ECR 2020
Poster Number:
C-00553
Type:
Educational Exhibit
Keywords:
Not applicable, Trauma, Congenital, Normal variants, Diagnostic procedure, Digital radiography, Conventional radiography, Musculoskeletal joint, Musculoskeletal bone, Extremities, Musculoskeletal
Authors:
R. Giovanetti González, I. Cifuentes García, C. Astor Rodriguez, S. Fernández Zapardiel, P. A. Baron Rodiz, A. Palomares Morales, Y. Herrero Gómez, V. Artiles, M. Céspedes; Toledo/ES
DOI:
10.26044/ecr2020/C-00553
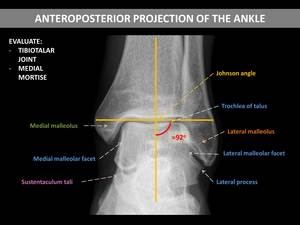
. Johnson angle is the angle between axis of tibia and tibial plafond.")
Fig. 1:
Evaluate the tibiotalar joint and the medial mortise (lateral mortise obscured...

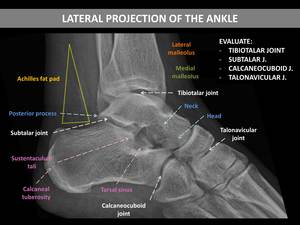
Fig. 2:
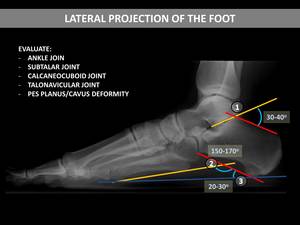
Evaluate the tibiotalar, subtalar, calcaneocuboid, and talonavicular joints....
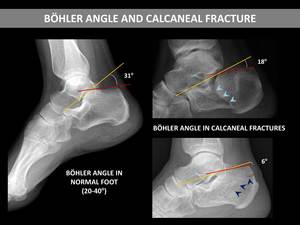
 A line from the highest point of the posterior margin of the calcaneus to the highest point of the posterior calcaneal tuberosity; and 2) A line connecting the posterior superior facet with the upper margin of the anterior process. The normal range is 20º-40º. Calcaneal fractures with talus impaction disrupt the subtalar joint and distort this anatomical angle to less than 20º.")
Fig. 3:
The Böhler’s angle is the angle formed by: 1) A line from the highest point...
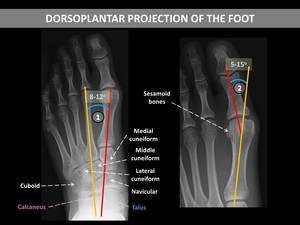
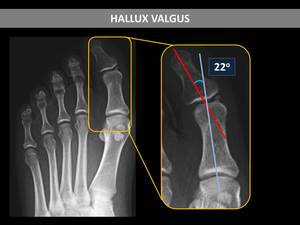
. The first intermetatarsal angle or metatarsus primus adductus angle (1) is the angle between the longitudinal axes of the 1st and 2nd metatarsal bones. The hallux valgus or hallux abductus angle (2) is formed by the longitudinal axis of the 1st proximal phalanx and the longitudinal axis of the 1st metatarsus.")
Fig. 4:
Evaluate the metatarsophalangeal and interphalangeal joints. Review the...
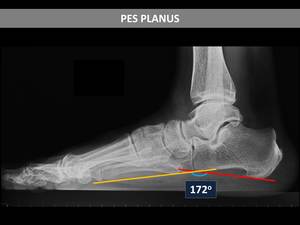
 and the angle between the tangent to the lower edge of the calcaneus and the tangent to the lower edge of the 5th metatarsal (2). The plane of support (blue) is the line connecting the most inferior point of the tuberosity of the calcaneus with the most inferior point of the 5th metatarsal head. The calcaneal inclination angle (3) is the angle between the plane of support and the calcaneal inclination axis (it is decreased in pes planus and increased in rearfoot cavus).")
Fig. 5:
Evaluate the ankle, subtalar, calcaneocuboid, and talonavicular joints. Examine...
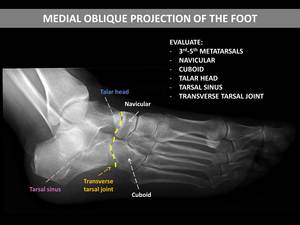
, navicular, cuboid, talar head, tarsal sinus, and transverse talar joint.")
Fig. 6:
Evaluate the 3rd-5th metatarsal bones (they appear without superimposition),...

Fig. 7:
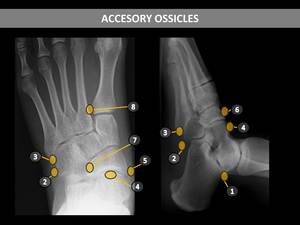
Accesory ossicles of the foot. 1. os trigonum. 2. os peroneum. 3. os...
.")
Fig. 8:
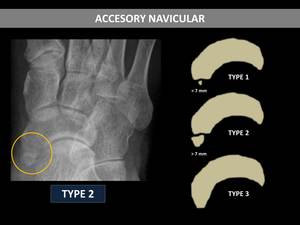
The accessory navicular bone is the most common accessory ossicle in the foot....

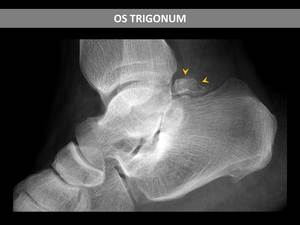
Fig. 9:
The os trigonum is a commonly found accessory ossicle located near the lateral...

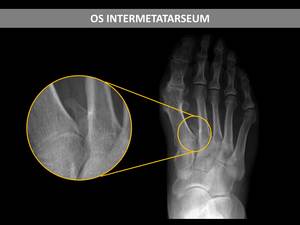
Fig. 10:
The os intermetatarseum is located between the bases of the two first...
.")
Fig. 11:
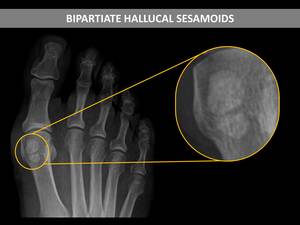
The sesamoid of the 1st metatarsal is bipartite in one-third of cases. This may...
, and less commonly between the 1st and 2nd metatarsals.")
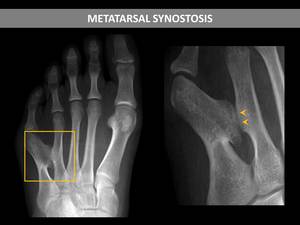
Fig. 12:
Synostosis is the osseous union of two adjacent bones. Synostosis of the...

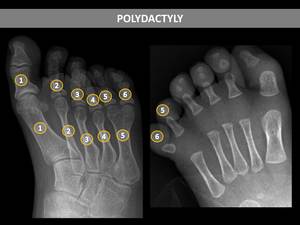
Fig. 13:
Polydactyly is the presence of supernumerary digits on the hands or feet.
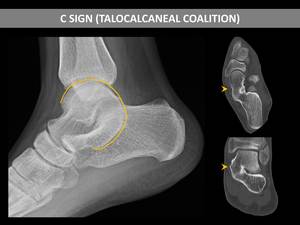
 coalition in the foot lateral view, which consist in a C-shaped line formed by the medial outline of the talar dome and the inferior outline of the sustentaculum tali, created by the overlap of the talus and the fused facets. The image shows a talocalcaneal coalition with the C-sign (curved line), confirmed in Computed Tomography (arrowheads point the abnormal joint).")
Fig. 14:
The C-sign is a classic radiologic finding of a talocalcaneal (subtalar)...
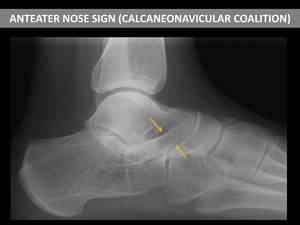
, which approaches or overlaps the navicular bone. It is indicative of calcaneonavicular coalition.")
Fig. 15:
The anteater nose sign relates to an anterior tubular elongation of the...
.")
Fig. 16:
Pes Planus (calcaneal-5th metatarsal angle higher than 170º).
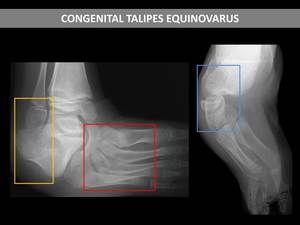
, hindfoot varus (blue) and forefoot adductus (red).")
Fig. 17:
Clubfoot with hindfoot equinus (yellow), hindfoot varus (blue) and forefoot...
.")
Fig. 18:
In hallux valgus, the metatarsophalangeal angle measures more than 15º (22º...
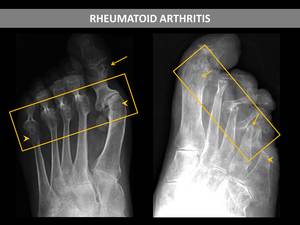
. Notice the erosive changes of multiple joints (arrows), most pronounced at the first MTP joint (with hallux valgus deformity), the joint space narrowing and the juxtaarticular osteopenia (arrowheads).")
Fig. 19:
Two cases of advanced rheumatoid arthritis with malalignment and subluxations...
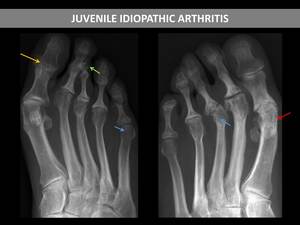
, showing juxtaarticular osteopenia (blue), joint space narrowing, erosions (green), periosteal new bone formation (red) and ankylosis (yellow).")
Fig. 20:
Two radiographs of the same patient (20 years), showing juxtaarticular...
, and bone proliferation (arrowheads).")
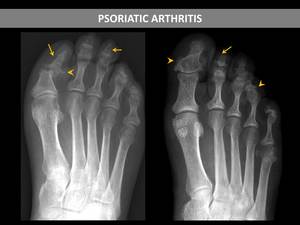
Fig. 21:
Two patients with psoriatic arthritis. The images show significant involvement...
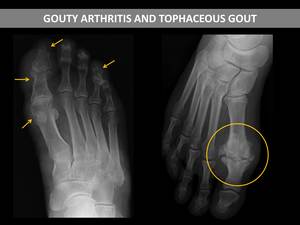
 and tophi (circle). The erosions are well-defined punched-out litic lesions (rat bite erosion). Tophi is a deposit of urate crystals which manifests as a soft-tissue swelling and can eventually erode the underlying bone with overhanging edges and well-defined sclerotic borders.")
Fig. 22:
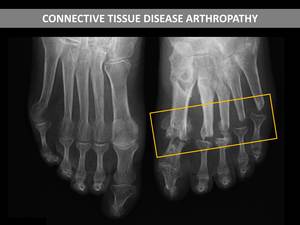
Gouty arthritis is the most frequent crystal-induced arthropathy, with...
. The patient was diagnosed with scleroderma.")
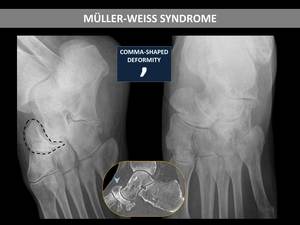
Fig. 23:
The radiograph of this female patient showed a markedly asymmetric...

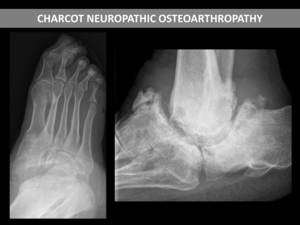
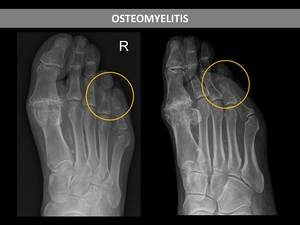
Fig. 24:
Loss of ankle mortice congruence and disorganization, osteophytes, subchondral...
, congruent with an extension of the infection to bone (osteomyelitis).")
Fig. 25:
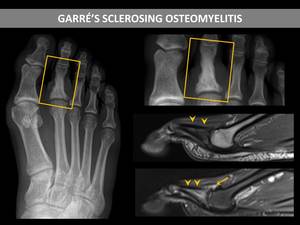
Diabetic patient with a soft-tissue infection. Radiographs showed lytic areas...
. MRI demonstrated bone edema (arrowheads) and mild associated synovitis (arrow). These findings suggest Garré’s sclerosing osteomyelitis.")
Fig. 26:
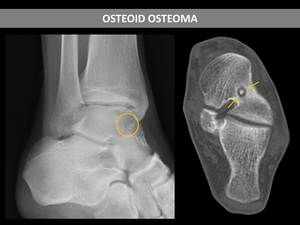
22-year-old patient with a history of stabbing trauma near the second finger....
. Subsequent CT demonstrated a lucent nidus with surrounding sclerotic reactive bone and a central sclerotic dot (arrows).")
Fig. 27:
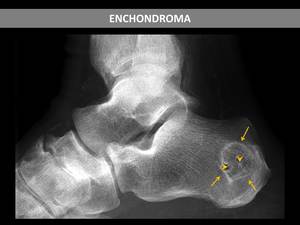
An oblique radiograph showed a well-circumscribed lucent region and adjacent...
, associating chondroid calcifications (arrowheads). It did not cause bone destruction or periosteal reaction.")
Fig. 28:
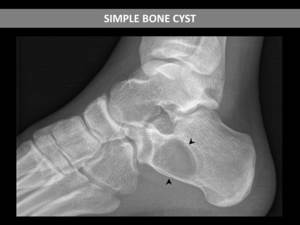
A lateral radiograph showed a well defined lytic lesion with sclerotic borders...
.")
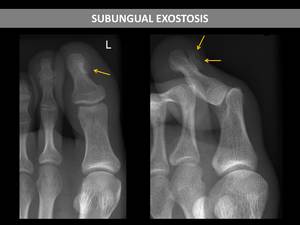
Fig. 29:
Exostosis at the medial and dorsal aspect of the distal first phalanx (arrows).
. CT demonstrated a unicameral bone cyst.")
Fig. 30:
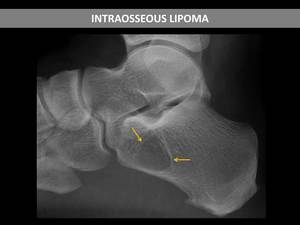
A lateral radiograph showed a well defined geographic lucent lesion with a...
. CT demonstrated an intraosseous lipoma.")
Fig. 31:
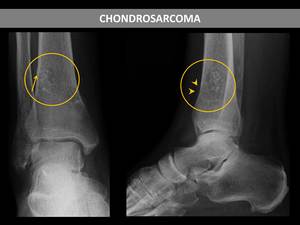
A lateral radiograph showed a well defined geographic lucent lesion with a...
, with intralesional chondroid calcifications (ring and arcs pattern), and periosteal reaction (arrowheads). Notice also the associated pathologic fracture (arrow). MRI and biopsy supported the diagnosis of chondrosarcoma.")
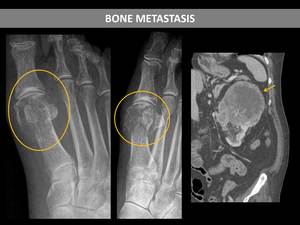
Fig. 32:
Radiographs showed a lytic lesion in the distal tibia (circle), with...
.")
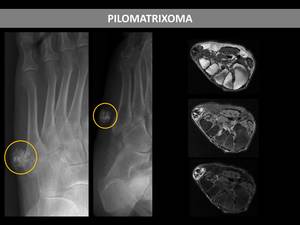
Fig. 33:
Radiographs showed a lytic lesion that occupied the epiphysis and the distal...
. The MRI findings and evolution were consistent with the diagnosis of pilomatrixoma.")
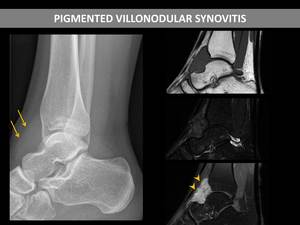
Fig. 34:
The radiograph showed a partially calcified nodule in the soft tissues adjacent...
, without affecting the underlying bone. MRI showed the presence of a well defined mass in that location, hypointense in T1 and T2-weighted images, and with marked enhancement after the administration of contrast (arrowhead), compatible with pigmented villonodular synovitis.")
Fig. 35:
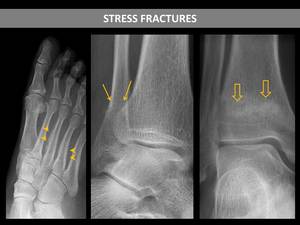
The radiograph showed a soft tissue swelling ahead of the ankle joint (arrow),...
, fibula (arrows point loss of cortical density and periosteal reaction), and tibia (void arrows point linear sclerosis).")
Fig. 36:
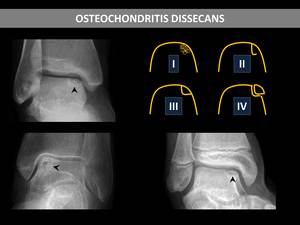
Stress fractures of metatarsals (arrowheads point periosteal reaction), fibula...
. We show three cases of osteochondritis dissecans (arrowheads).")
Fig. 37:
Radiographic classification of osteochondral lesions of the talus (I: a small...
.")
Fig. 38:
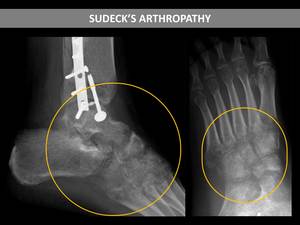
The oblique and AP radiographs of the same patient depicted deformity and...
 following trauma (ankle fracture), without bone erosion or joint space narrowing, compatible with complex regional pain syndrome.")
Fig. 39:
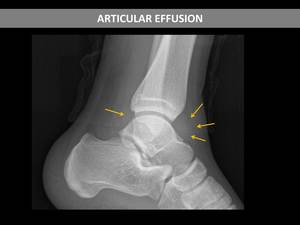
Patient with aggressive osteopenia (circle) following trauma (ankle fracture),...
, compatible with articular effusion.")
Fig. 40:
Teardrop-shaped “masses” anterior and posterior to the tibiotalar joint...
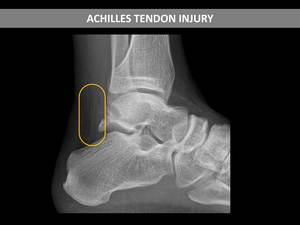
 fat pad (circle), in a patient with acute tendon rupture.")
Fig. 41:
Distortion of the Kager (pre-Achilles) fat pad (circle), in a patient with...

Fig. 42

Fig. 43

Fig. 44