Keywords:
Experimental, Not applicable, Dosimetric comparison, Physics, Dosimetry, CT, Radioprotection / Radiation dose, Performed at one institution
Authors:
K. Takegami1, H. Hayashi2, T. Asahara1, S. Goto1, E. Tomita2, N. Kimoto2, Y. Kanazawa3, S. Kudomi4; 1Kanazawa, Ishikawa/JP, 2Kanazawa/JP, 3Tokushima/JP, 4Yamaguchi/JP
DOI:
10.26044/ecr2020/C-01393
Results
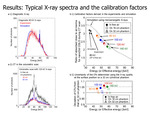
As shown in Fig. 7, the background X-rays were experimentally detected and subtracted. In the right figure, the red line shows the spectrum corrected for the response function of the CdTe spectrometer, the X-ray energy and the probability of the Compton-scattering effect. Using corrected spectra (see Fig. 8(a-1)), the CFs of the diagnostic X-ray of 80 kV derived from the experiments and Tucker’s formula were plotted as gray data of Fig. 8(b-1). The experimental results were in good agreement with the Monte-Carlo simulation. This fact means that the measured spectra can be applied to determine the CFs experimentally. Fig. 8(a-2) shows typical spectra during volumetric CT scans, and the CFs were shown in the colored data of Fig. 8(b-1). It was found that the CFs varied depending on the effective energy and were different from those simulated using monoenergetic X-rays. This result means that the CF should be determined taking into consideration the X-ray quality at the dosimetric position.
In Fig. 8(b-2), the relative CFs normalized to the CFs at the surface position of the 32 cm phantom were shown to evaluate the uncertainty of the CFs. The results of 16 cm phantom were plotted within 5% for each tube voltage. It was reported that the cylindrical acrylic phantoms having diameters of 16 cm and 32 cm corresponded to patient body sizes of less than 30 kg and approximately 90 kg, respectively [16]. This means that the determined CFs can be applied to measure the ESD of standard adult patients within an accuracy of 5% when dose calibration is performed using the X-ray quality corresponding to the surface position of a 32 cm phantom.


