Keywords:
Not applicable, Retrospective, Image verification, Computer Applications-Detection, diagnosis, MR, Neuroradiology brain, Artificial Intelligence and Machine Learning, Multicentre study
Authors:
D. Sima1, G. Wilms1, T. Vande Vyvere2, W. Van Hecke3, D. Smeets1; 1Leuven/BE, 2Leuven, Be/BE, 3icometrix, Belgium/BE
DOI:
10.26044/ecr2020/C-11342
Methods and materials
Longitudinal MRI acquisitions approximately 1 year apart were collected from 25 multiple sclerosis patients. The icobrain software [1] was used to compute lesion load (including new and enlarging lesions) and brain volumetry (including annualized atrophy). These findings were automatically inserted in a radiology reporting template.
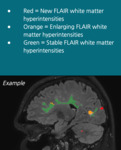
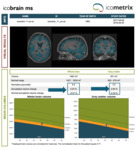
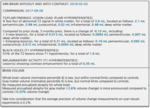
Each MRI dataset, which included images from two time points (TP1 and TP2, see figure 1), was presented in random order to an experienced radiologist twice: once without and once with automatically generated report. In the latter case, besides color-coded lesion overlays in DICOM format (see figure 2), the radiologist also had access to the standard icobrain ms report in PDF format (see figure 3) and to the prepopulated radiology reporting template for icobrain ms in plain text (see figure 4).
In both scenarios (without and with software-generated reports), final radiological reports were created by the radiologist. The time necessary to complete each report was recorded.
Statistical analysis was performed in order to compare the two radiological reporting scenarios (without and with software results).
Timing results were compared with the paired t-test and Wilcoxon signed-rank test at significance level 0.01. Radiological findings were compared by counting the patients considered stable, slightly active and active in each reporting scenario, and cross-checking these findings between the two scenarios. In both cases, patients were considered:
- stable if they had no new or enlarging lesions and had normal rate of brain atrophy compared to controls (within 0.2% from normal atrophy rate of sex- and age-matched healthy controls in the case of icobrain ms measurements);
- slightly active if they had enlarging lesions or slightly abnormal atrophy rate compared to controls (further than 0.2% but within 0.4% from normal atrophy rate of sex- and age-matched healthy controls in the case of icobrain ms measurements);
- active if they had new lesions or severe progression of brain atrophy (further than 0.4% from the normal atrophy rate of sex- and age-matched healthy controls in the case of icobrain ms measurements).


