ECR 2020 / C-13948
Cardiac Fibroma: is T1 mapping “the new tool” for a correct diagnosis?
Congress:
ECR 2020
Poster Number:
C-13948
Type:
Educational Exhibit
Keywords:
Cardiac, Contrast agents, MR, Education, Tissue characterisation, Retrospective, Observational, Performed at one institution
Authors:
S. Pradella1, M. Letteriello1, C. De Amicis1, M. Acquafresca1, E. Bertelli1, G. Grazzini1, V. Miele2; 1Florence/IT, 2FIRENZE/IT
DOI:
10.26044/ecr2020/C-13948
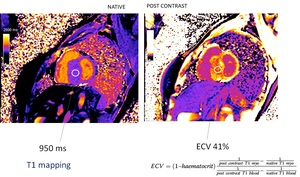
 and T1 mapping after the administration of contrast media (b). We used dedicated software to calculate the T1 values of the myocardium and the ECV on the three slices obtained (basal, mid and apical)")
Fig. 2:
Fig. 2: native T1 mapping (a) and T1 mapping after the administration of...
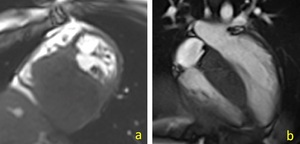
 Girl 5 years old with a voluminous mass that arises in the posterior interventricular septum, mean size of 5.5 cm, which slightly reduces the size of the ventricular cavity, on the cine-short axis sequence; b) Young woman, 14-year-old, who came to our observation for suspected asymmetric septal hypertrophy: CMR shows the presence of a large mass in the basal and mild septum (cine- long axis 4 chamber)")
Fig. 3:
Fig. 3: a) Girl 5 years old with a voluminous mass that arises in the posterior...
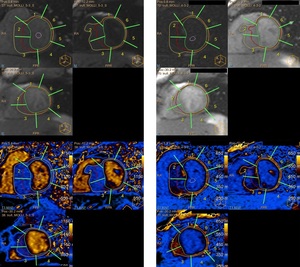
, although different in the same patient compared to healthy segments. The extracellular volume fraction (ECV) of the mass was higher than that of the myocardium (>40% vs. 23-26%, respectively")
Fig. 4:
Fig. 4: The T1 native values of the tumor is similar to the T1 of myocardial...

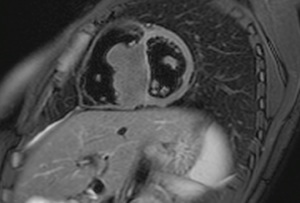
Fig. 5:
Fig.5: The tumor is slightly hypointense to myocardium on T2-weighted images...
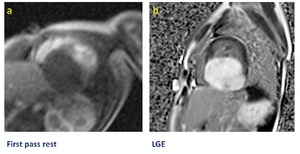
 and hyperenhancement on LGE (b)")
Fig. 6:
Fig. 6: Cardiac fibroma shows little or no enhancement during the early phases...