Keywords:
Neuroradiology brain, MR, MR-Diffusion/Perfusion, Computer Applications-3D, Computer Applications-Detection, diagnosis, Computer Applications-General, Dementia
Authors:
N. Zdanovskis, A. Platkajis, A. Kostiks, K. Šneidere, A. Stepens, G. Karelis
DOI:
10.26044/ecr2022/C-10232
Results
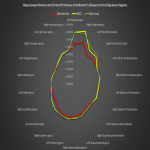
To make an initial evaluation of obtained hippocampal volume values and Alzheimer's disease cortical signature values we made a spider diagram, that could be seen in Figure 2.
By performing the Kruskal-Wallis test we found statistically significant (p<0.05) differences between groups in:
- left hippocampus and right hippocampus where statistically significant differences were observed between D-MCI and D-NC groups, but no statistically significant differences between MCI-NC groups,
- left entorhinal cortex and right entorhinal cortex where statistically significant differences were observed between D-MCI and D-NC groups, but no statistically significant differences between MCI-NC groups,
- left supramarginal gyrus where statistically significant differences were observed between D-MCI and D-NC groups, but no statistically significant differences between MCI-NC groups,
- left fusiform gyrus where statistically significant differences were observed between D-MCI and D-NC groups, but no statistically significant differences between MCI-NC groups,
- left parahippocampal gyrus and right parahippocampal gyrus where statistically significant differences were observed between D-MCI and D-NC groups, but no statistically significant differences between MCI-NC groups,
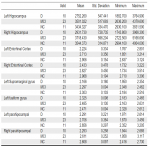
The descriptive statistics with average values and standard deviations are available in Figure 1.


