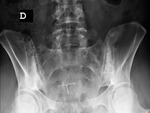
In this section,
we show the main active and chronic changes of the sacro-iliac joint and spine in patients with different stages of SpA.
Sacro-iliac joint - Active inflammatory lesions
- Inter-articular fluid collection – best seen on MRI due to the high sensitivy of T2WI sequences to fluid; T2WI with fat-saturation and STIR sequences are recommended;
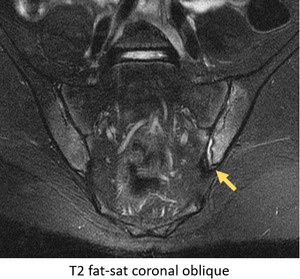
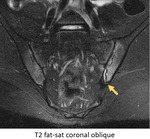
Fig. 21: MRI - STIR coronal oblique slice: moderate synovial fluid on the left sacro-iliac joint (arrow). There is also extensive bilateral bone marrow edema. Patient with Crohn's Disease.
- Bone marrow edema / osteitis – may be found in other pathologies; in SpA,
affected areas are peri-articular and are frequently associated with other strucutral changes (e.g.
erosions); low-intensity signal on T1 and high-intensity signal on T2WI,
especially with fat-saturation and STIR sequences; after gadolinium injection,
significant enhancement of the SI joint and surrounding bone marrow can be observed,
which is highly suggestive of active disease;
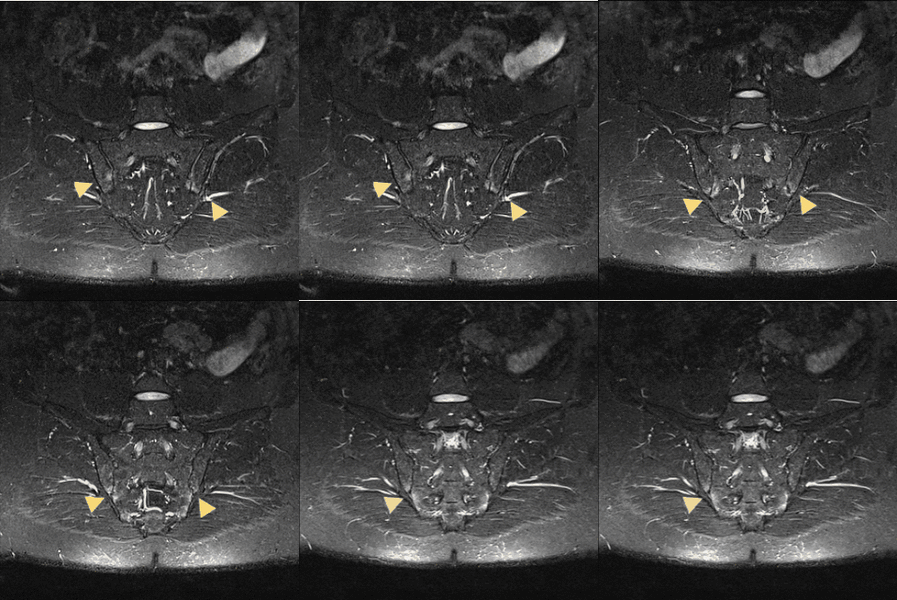
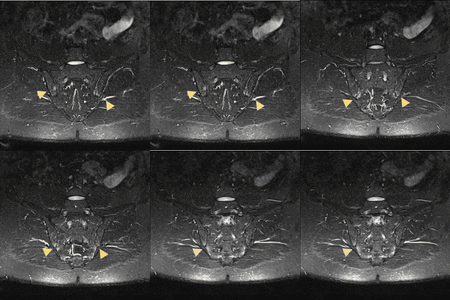
Fig. 22: MRI - STIR coronal oblique sections: several small foci of bone marrow edema (arrowheads) are present near the iliac and sacral articular surface, more prominent at the inferior and anterior portion of the sacro-iliac joint. Patient with suspected AS.
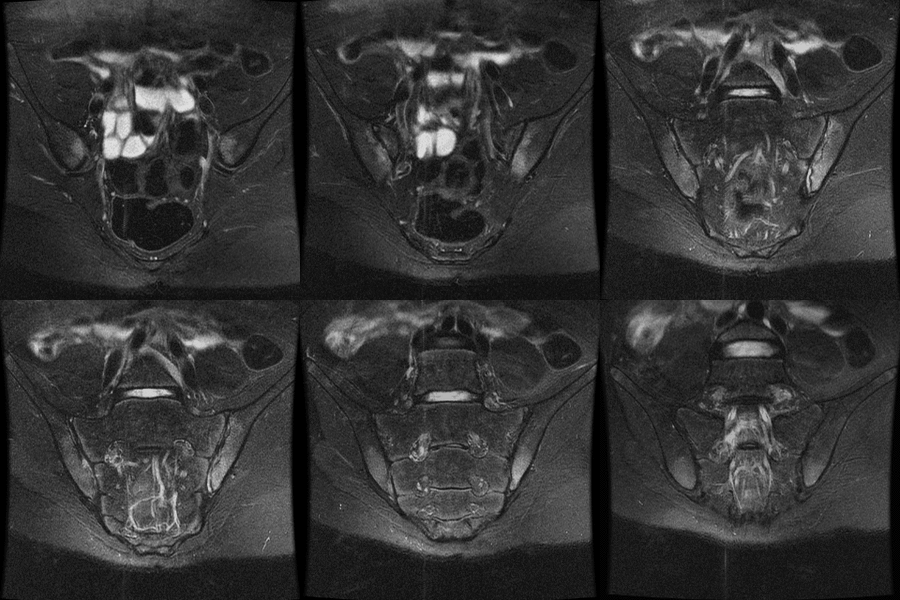
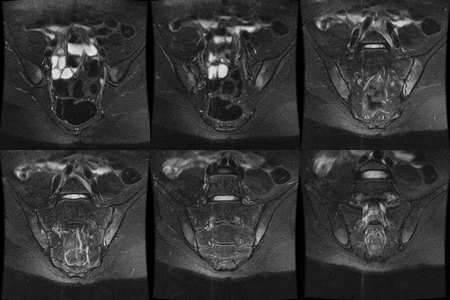
Fig. 23: MRI - STIR coronal oblique sections: extensive bone marrow edema on the iliac and (less) on the sacral side of both sacro-iliac joints; there is also moderate synovial fluid on the left joint. Patient with Crohn's Disease.
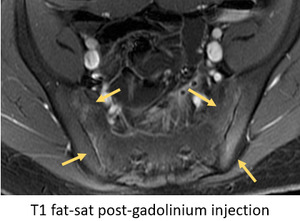
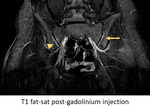
Fig. 24: T1 fat-saturated images after gadolinium injection confirms that bone marrow edema is due to osteitis /inflammation. there is also uptake by the synovial joint, indicative of synovitis.
- Synovitis and synovial proliferation – hyperintensity on contrast-enhanced fat-saturated images at the synovial part of the SI joints (it is important to distinguish from synovial fluid which is high on STIR sequences and low on T1WI ); synovial proliferation corresponds to replacement of articular cartilage by pannus,
resulting in heterogeneous signal with areas of focal thickening with hypersignal on T2WI and after contrast uptake;
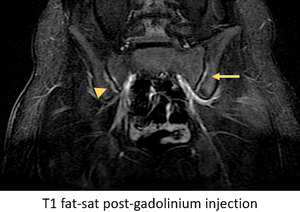
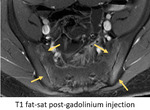
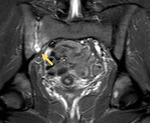
Fig. 25: On the left SI joint, there are areas of contrast uptake at the synovial joint, suggestive of synovitis (arrow). On the right SI joint, there is contrast uptake by subchondral bone, indicative of osteitis (arrowhead).
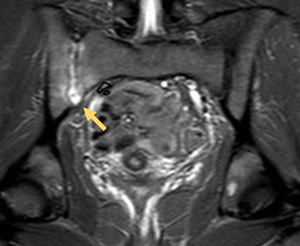
Fig. 26: T1 fat-saturated sequence after gadolinium injection shows extensive synovitis at the antero-superior portion of the right SI joint and reactive osteitis.
- Capsulitis – similiar to synovitis in signal,
but involves predominantly the anterior and posterior capsule,
where it continues with the periosteum of the iliac and sacral bones and corresponds to an enthesis
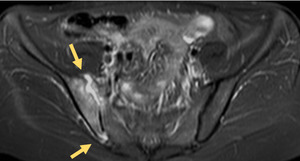
Fig. 27: Marginal capsulitis on the superior and inferior edges of lfet SI joint.
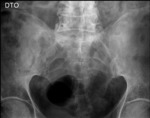
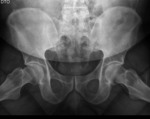
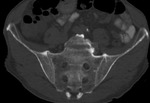
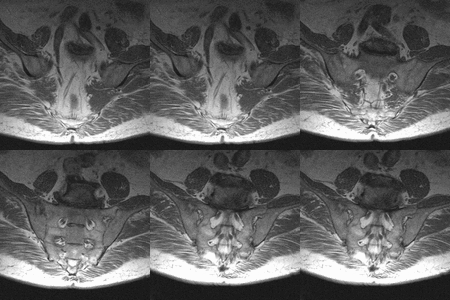
Sacroiliac joint – chronic changes
- Cortical bone erosions and pseudo-widening of joint space - bony defects on the low signal intensity on T1WI and high on STIR images if active; T2 GE or T1 Fat-sat may be more useful; margin irregularity and deeper defects also affecting the adjacent bone marrow; better demonstrated on T1WI with fat-saturation
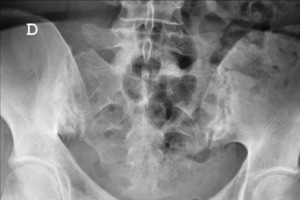
Fig. 28: Cortical bone erosions and pseudo-widening of the left SI joint.

Fig. 29: CT - coronal oblique reconstructions: irregularity of the sacro-iliac joint due to small erosions. Patient with AS.
- Joint space narrowing - late-stage sacro-iliac joint arthropathy due to reactive bone sclerosis and cartilage thinning from persistent inflammation and erosions.
The cartilage lining the iliac side of the joint is the first to become affected since it is thinner than the sacral lining
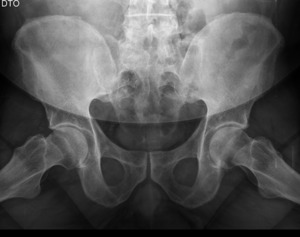
Fig. 30: Right sacro-iliac joint space narrowing, joint space widening on the anterior portion of the left sacro-iliac joint (presumably due to erosions) and apparent bone-bridging of its posterior portion. Patient with AS.
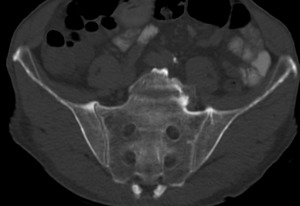
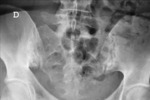
Fig. 31: CT - coronal oblique reconstruction; bilateral joint space narrowing of the sacro-iliac joints; juxta-articular osteopenia (more evident on the sacral side); superior edge sclerosis with bone-bridging (capsule or ligamentous calcifications). Patient with AS.
- Subchondral sclerosis - more easily depicted on radiographs and CT,
it can be evident on MRI as low-intensity or signal free bands in all sequences,
without signal enhancement after contrast medium administration; if attributable to SpA,
bone sclerosis should extend at least 5 mm from the SI joint space
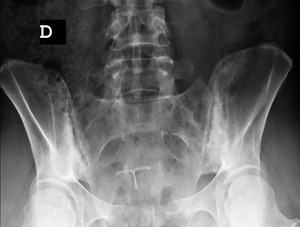
Fig. 32: Ferguson view - marked bone sclerosis (> 5 mm away from joint) of the ilium side of the sacro-iliac joints in patient with AS.
- Fat depositions/collections – post-inflammatory changes,
characterised by an increased signal intensity on T1WI; accumulation results from esterification of fatty acids in inflammatory,
often periarticular,
bone marrow areas

Fig. 33: MRI - several sequences show: patchy bone changes with hypersignal on T1 and T2 WI, that are not evident on STIR sequence, highly suggestive of fatty deposits on previously inflamed bone marrow. Patient with Crohn's Disease.
- Ankylosis / bone bridging - bone bridges fromed across the joint that fill in the joint cavity; best depicted on CT; on MRI,
there is low signal intensity on all sequences,
sometimes surrounded by high T1 signal from fatty degeneration

Fig. 34: Extensive bilateral bone-bridging with ankylosis of a significant portion of the sacro-iliac joints. Patient with AS.
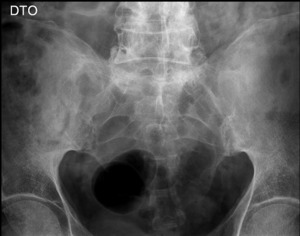
Fig. 35: Near-complete ankylosis of both sacro-iliac joints with preservation of joint space at the anterior edge. Patient with AS.
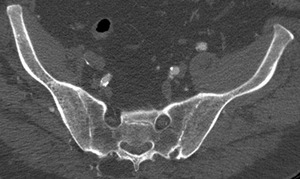
Fig. 36: CT coronal oblique reconstructions depict bilateral ankylosis of the SI joints in patient with Ankylosing Spondylitis.
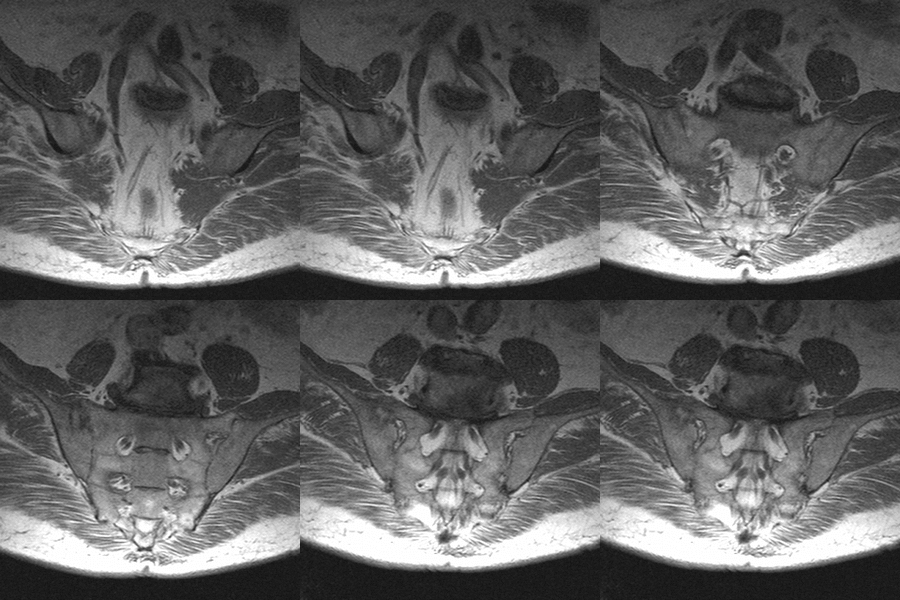
Fig. 37: MRI - T1WI coronal oblique sections: bone bridging and ankylosis on several segments of the sacro-iliac joints. Patient with AS.
- Juxta-articular osteoporosis - lack of joint mobility,
under-use and reaction to focalised inflammation with high subchondral bone turnover alter the juxta-articular bone density

Fig. 36: CT coronal oblique reconstructions depict bilateral ankylosis of the SI joints in patient with Ankylosing Spondylitis.

Fig. 38: CT - coronal oblique reconstructions: juxta-articular osteoporosis in patient with advanced sacro-iliac joint spondyloarthropathy.
Spine - Active inflammatory lesions
- Spondylitis and enthesitis (Romanus spondylitis) – inflammatory changes involving the edges of the vertebral endplates/bodies; anterior edge involvement is secondary to enthesitis of anterior longitudinal ligament (Romanus lesion),
and posterior edges due to posterior longitudinal ligament inflammation; hyperintense edematous corners are seen on T2 and T1 WI after injection of gadolinium;
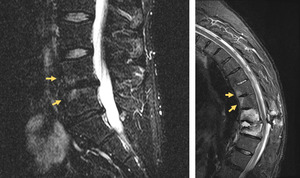
Fig. 39: MRI - left - STIR sequence: bone marrow edema at the corners of the endplates of L4 and L5; right - T2 fat-saturation sequence. Patient with AS and sub-acute spinal fracture shows corner bone marrow edema at the superiorly adjacent vertebrae.
- Aseptic spondylodiskitis (inflammatory Andersson Lesion) – inflammatory changes involving the diskus with erosions of the adjacent vertebral endplates at teh center (it is important to distinguish from peripheral enthesitis-related erosions).
They appear hyperintense on T2WI and T1 WI after injection of gadolinium
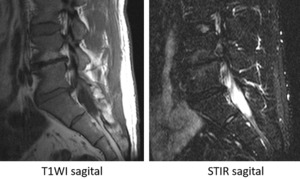
Fig. 40: ASeptic spondylodiskitis - Andersson Lesion confirmed by excluding high-signal on T2 due to fat deposition. High signal is still evident on the vertebral endplate on STIR sequences, suggestive of central bone marrow edema.
- Zygoapophyseal / Facet joint arthritis – involvement of any facet joint from C2 to S1 is possible,
with evidence of bone marrow edema,
effusion and/or erosions within spinal pedicles
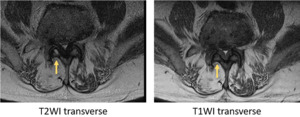
Fig. 41: Inter-apophyseal joint inflammation in patient with Ankylosing Spondylitis (arrows).
- Costovertebral and costo-transverse joint arthritis – involvement of any joint from Th1 to Th12; with bone marrow edema,
effusion and erosions that may extend to posterior aspect of vertebral bodies,
pedicles and neighbouring rib
- Inflammation of spinal ligaments (not-enthesitis related) – T1 fat-sat after injection of gadolinium are more sensitive than STIR or T2 Fat-sat to detect this type of involvement; any vertebral ligament may be affected,
most often the interspinal and supra-spinal ligaments
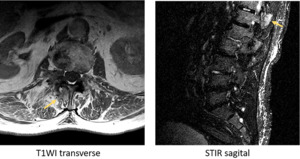
Fig. 42: Inter-apophyseal joint inflammation in patient with Ankylosing Spondylitis (arrows).
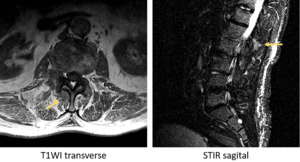
Fig. 43: Inter-apophyseal joint inflammation in patient with Ankylosing Spondylitis (arrows).
Spine - chronic lesions
- Syndesmophytes – bone outgrowth forming osseous bridges between two adjacent verebrae,
is characteristic of spondyloarthropathies; their initial directions are vertical,
which differentiates them from osteophytes; they represent the end stage of Romanus spondylitis
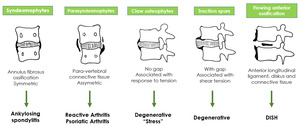
Fig. 44: Patterns of para-vertebral ossification in different disorders.
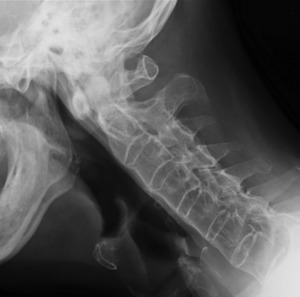
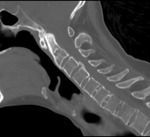
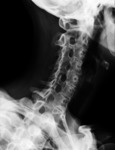
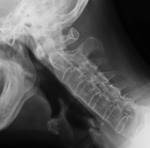
Fig. 45: Bone-bridging /ankylosis of cervical spine due to advanced syndesmophytes.
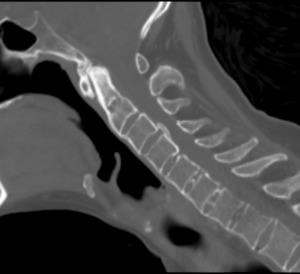
Fig. 46: Anterior and posterior syndesmophytes.
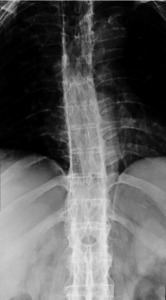
Fig. 47: Railroad track sign in patient with Ankylosing Spondylitis.
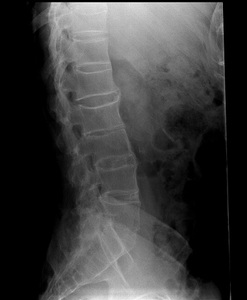
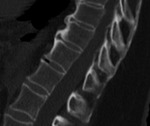
Fig. 48: Lumbar spine syndesmophytes.
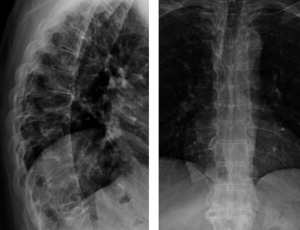
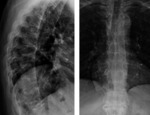
Fig. 49: Dorsal spine syndesmophytes.
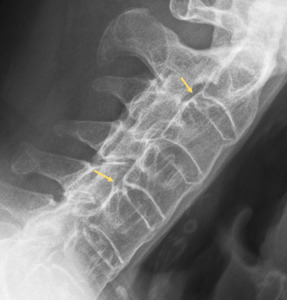
Fig. 50: Posterior syndesmophytes.
- Ligament calcifications - ossification of ligaments at the enthesis is frequently seen in advanced-stage AS,
where it is generally continuous and,
if untreated,
contribute to development of a stiff,
bamboo spine.
patients with bone bridging and osteopenia have a high propensity for spinal fractures.
Several signs have been described on evaluation of advanced-AS,
such as the tramline sign,
the dagger sign and the trolley track sign;
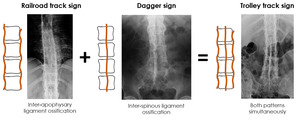
Fig. 51: Ligament calcification patterns.
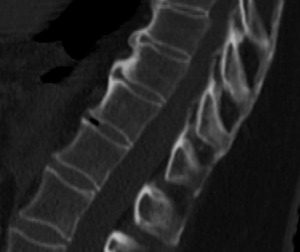
Fig. 52: Bridging syndesmophytes.
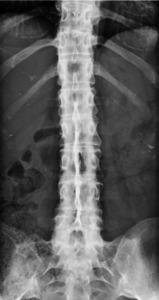
Fig. 53: Lateral syndesmophytes.
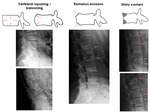
- Sclerotic changes - Romanus spondylitis not only promotes erosions but,
on a later stage,
can cause reactive sclerosis with formation of so-called "shiny corners"; they are well depicted on radiographs and CT
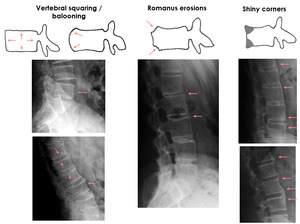
Fig. 54: Sclerotic bone changes of the vertebral endplates (left and right); Romanus lesions with corner erosions (middle).
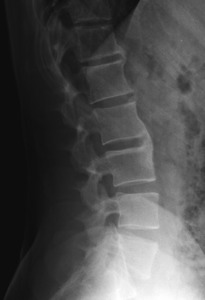
Fig. 55: "Shiny corners" on vertebral endplates with advanced syndesmophytes.
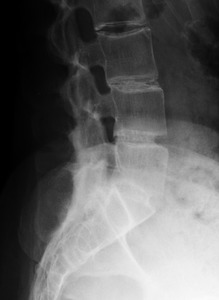
Fig. 56: Dystrofic calcification of the intervertebral disks. "Shiny corners" due to bone sclerosis of the corners of the vertebral endplates.
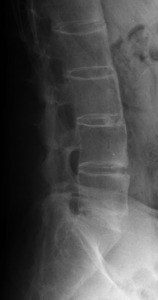
Fig. 57: Dystrofic calcification of the intervertebral disks. "Shiny corners" due to bone sclerosis of the corners of the vertebral endplates.
- Bone bridges/ankylosis – syndesmophytes are a responsible for the development of peripheral vertebral spinal ankylosis; it may also be central,
secondary to bone formations passing through the disk; ankylosis of zygapophyseal joints may also be oserved
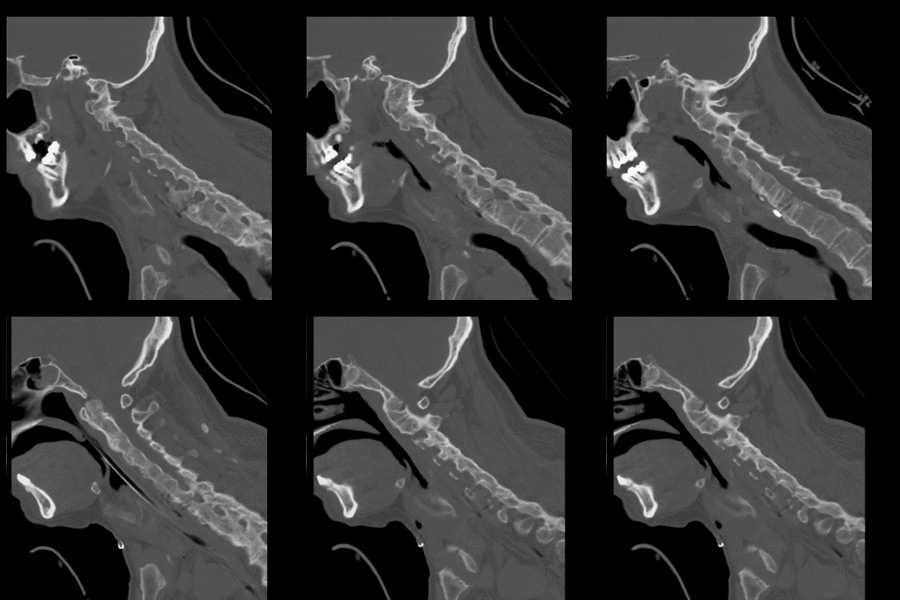
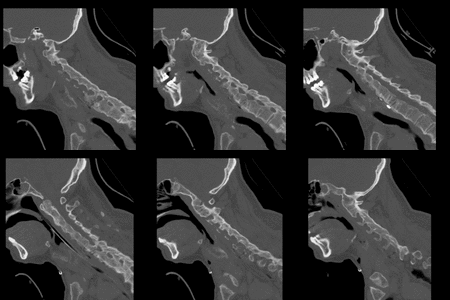
Fig. 58: CT sagital slices - near-total ankylosis of the zygoapophyseal joints in patient with Ankylosing Spondylitis. Note the anterior cervical syndesmophytes and dystrofic calcification of the inter-vertebral disks.
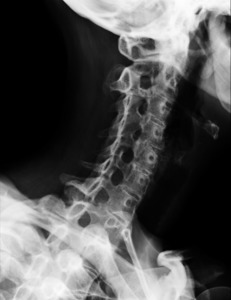
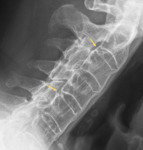
Fig. 59: Radiograph - cervical oblique view - bone bridging of the inter-apophyseal joints.
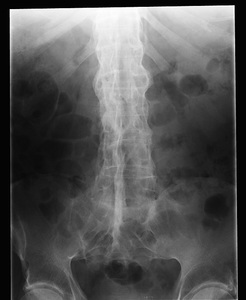
Fig. 60: Inter-spinous ligament calcification with Dagger Sign in patient with Ankylosing Spondylitis,.
- Fat deposition on vertebral corners and other previously inflamed bone marrow – similar to the SI joint,
previously inflamed tissue adjacent to bone promotes fatty deposition,
namely on vertebral plate corners (due to Romanus spondylitis) and central end-plates (due to Andersson lesions); they are well depicted on MRI by comparing high signal on T1/T2 sequences with STIR or fat-saturated images;
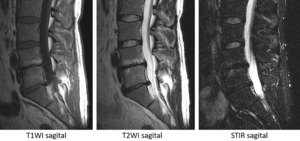
Fig. 61: Fat-deposition on the subchondral plates of L4-L5, confirmed with hyper-intensity on T1 and T2 WI and hypointensity on STIR sequences.
- Osteopenia and osteoporosis – lack of joint mobility,
under-use and reaction to focalised inflammation with high subchondral bone turnover alter the juxta-articular bone density
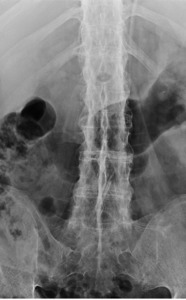
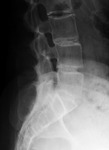
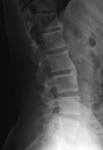
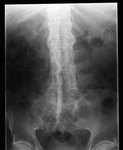
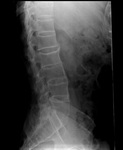
Fig. 62: Marked osteopenia of the lumbar vertebrae in patient with advanced Ankylosing Spondylitis.
Clinical case – Dorsal fracture in patient with ankylosing spondyloarthropathy
- 52 year-old male with a personal history of Ankylosing Spondylitis diagnosed 10 years before event,
COPD and bilateral hip prosthesis.
- Attends a neurosurgical appointment for correction of advanced cyphosis,
complaining of persistent mechanical pain irradiating for the dorsal and lumbar regionfor the past 7 weeks.
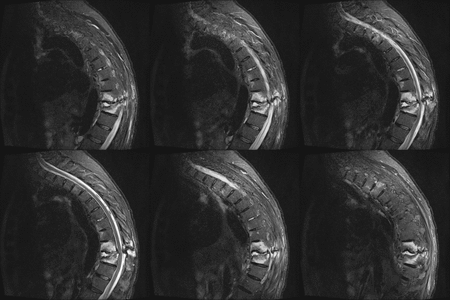
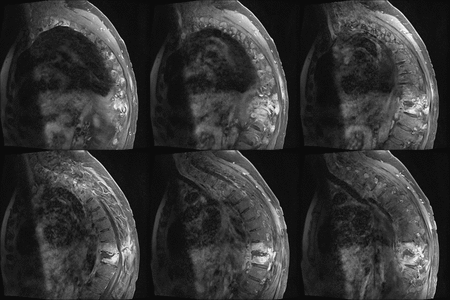
- High suspicion of a vertebral fracture prompts urgent spine MRI assessment:
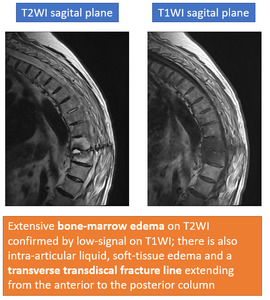
Fig. 63: MRI sequences showing vertebral fracture.
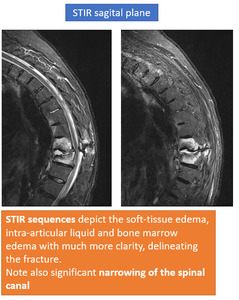
Fig. 64: MRI sequences showing vertebral fracture.
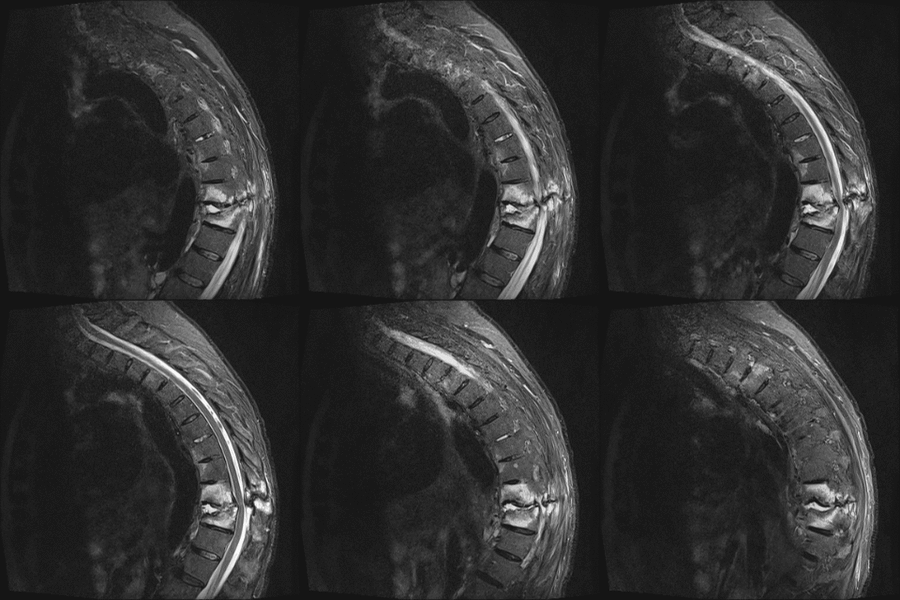
Fig. 65: STIR sequences. Different sagittal planes are shown. Extensive intervertebral fluid and bone marrow edema along the surfaces of the bones delimitating the fracture. Note signs of instability with spinal canal stenosis.
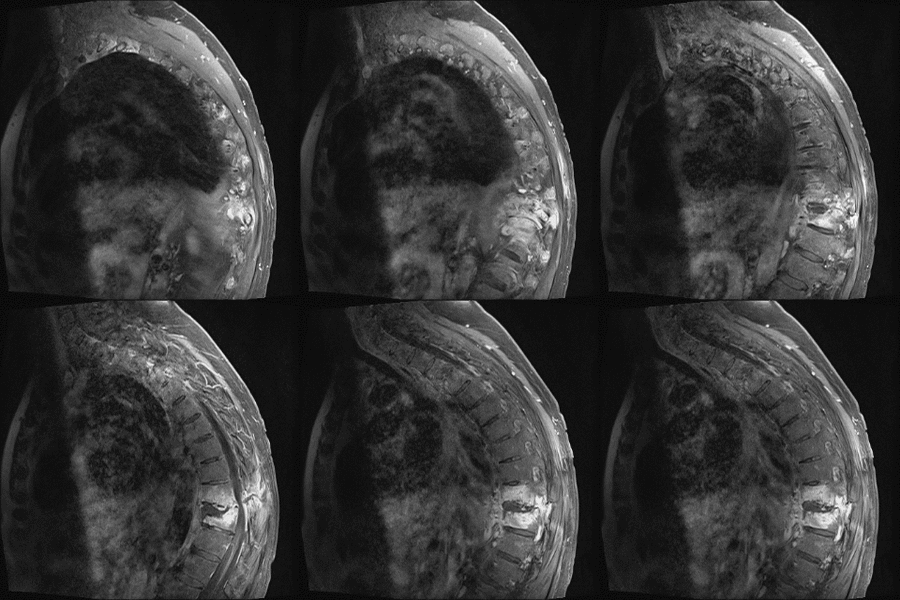
Fig. 66: T1 fat-saturated sequence after gadolinium injection. Different sagittal planes are shown. Extensive contrast uptake at the intervertebral disk where the fracture takes place and along its course through the middle and posterior column.
Patient underwent emergent surgery for fixation and stabilisation of the fracture and was discharged 153 days later,
due to severe post-surgical infections and several re-interventions.

