Analysis of muscle mass:
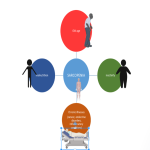
- Analysis of muscle mass is important in diagnosis of sarcopenia[4].
- These can be assessed by:
- Non-imaging technique such as bioelectrical impedance analysis (BIA) which calculates muscle mass and fat mass. However errors are not uncommon due to hydration, exercise or nutrition status.
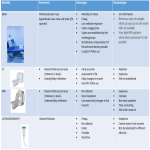
- Imaging techniques. These are reliable in assessment and quantification of muscle or fat mass. They are not only useful in diagnosis but also for follow up after initiative corrective measures or appropriate treatment. The various modalities, advantages and disadvantages are discussed in the figure (fig.3)
.
Dual Energy Xray Absorptiometry (DEXA):
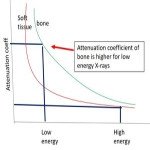
DEXA principle is based on the fact that attenuation co-efficient of different tissues (such as bone or soft tissues) decrease at different rates with increase in energy. The difference in attenuation is higher with low energy X-ray beams(compared to high energy beams) (fig.4)
. .
X-ray beams of 2 different energy peak levels (either as pencil/fan beam) are passed through the tissue and the differential attenuation of the tissues namely bone, lean mass/muscle and fat, captured by the detectors are measured by computer algorithms (fig. 5)
.
The machine calculates the fat mass (g), body lean mass (g) and also BMD (g) from various anatomical regions and gives the whole body values.
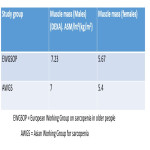
The cut-off of normal muscle mass (ASM/ht2) is given in the table (fig.6)
.
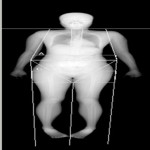
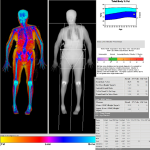
An example of case of reduced muscle mass is shown (fig. 7)
.
Computed Tomography (CT):
CT can reliably evaluate the muscle mass and the fat within a cross-sectional area. It can also be very helpful in assessment of fatty infiltration within the skeletal muscles.
The measurement of total abdominal muscle area (TAMA) is usually done at L3 vertebral level. Rarely few studies have used Psoas muscle and mid-thigh muscle with specific cutofff points.
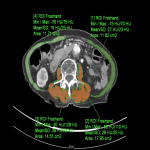
Cutoff value for muscle area at L3 level – 52.3 cm2/m2 (men) and 38.5 cm2/m2 (women) , according to Prado et al. [5]. An example of case of reduced muscle area (TAMA) is shown (fig. 8)
.
Recently artificial intelligence assisted segmentation and measurement has been studied and the results appear to be promising.
MRI:
MRI provides the best contrast resolution between the various soft tissues. However MRI is not a popular modality to assess muscles in the diagnosis of sarcopenia. TAMA at L3 level or thickness of muscles in the mid thigh provide good estimation of muscle mass and also volume of fat.
Ultrasound:
Ultrasound is a good option for evaluating the muscle mass as a screening tool. It is readily available, faster and there is no risk of radiation. Usually the mid thigh is chosen for the measurement of the thickness of the muscle (thigh muscle thickness, TMT).
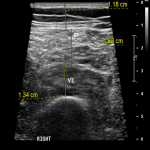
Cutoff value for TMT – 36mm (men) and 34mm (women) (which has a sensitivity of 72% and specificity of 72-74%) according to Hida et al[6]. An example is shown (fig. 9)
.

